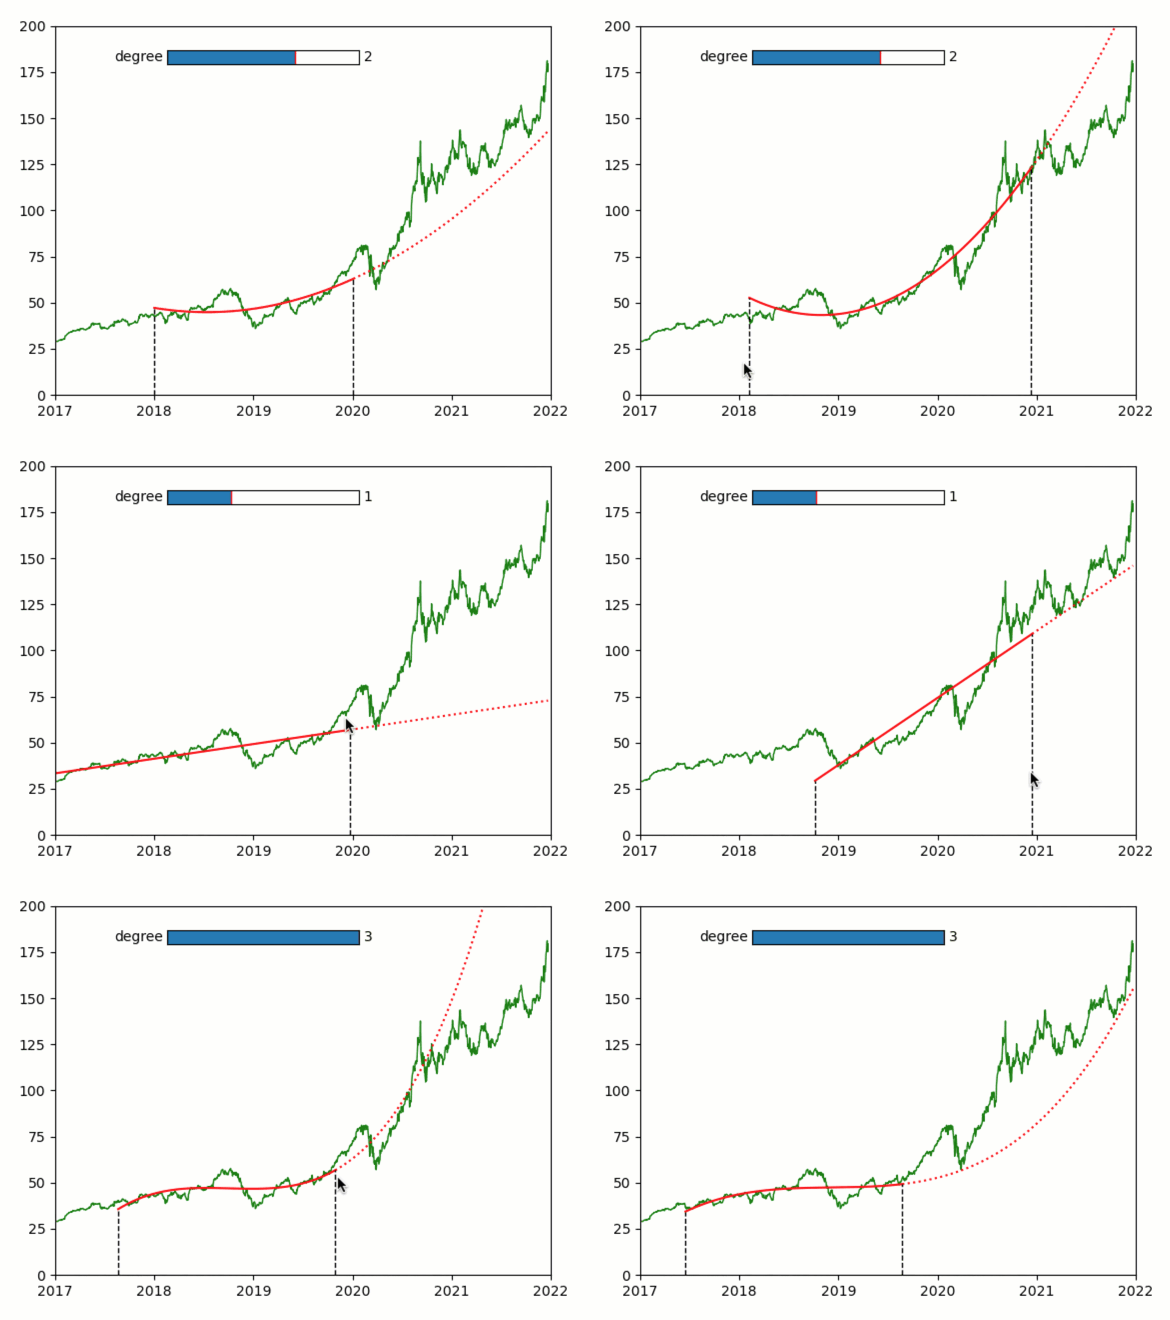
Polyfit of stock value
A simple demo of an interactive polyfit extrapolation of stock values
Features
Graphics quibs
Graphics-driven assignments
Quib-linked widgets
Inverse assignments
Try me
Drag the cyan marker to move the fit period.
Drag the dashed lines to change the width of the fit period.
Use the slider to change the polynomial degree of the fit.
from pyquibbler import iquib, initialize_quibbler, q
initialize_quibbler()

import matplotlib.pyplot as plt
import numpy as np
from matplotlib.widgets import Slider
from datetime import datetime
%matplotlib tk
# Load data of Apple stock:
t_init = datetime.strptime('2000-01-01', '%Y-%m-%d').timestamp()
str2date = lambda x: (datetime.strptime(x.decode("utf-8"), '%Y-%m-%d').timestamp()
                      - t_init) / (365 * 24 * 60 * 60) + 2000
filename = iquib('AAPL.csv')
d = np.genfromtxt(filename, delimiter=',', names=True, converters = {0: str2date})

# Initiate a figure:
plt.figure()
plt.axis([2017, 2022, 0, 200])

# Plot the stock values:
t = d['Date']
y = d['Open']
plt.plot(t, y, 'g', lw=1)

# Define fit parameters:
t_final = iquib(2020.)
dt = iquib(2.)
n = iquib(2)

# define t_initial, starting with dt so that changes in t_initial affects dt
t_initial = -dt + t_final

# Define downstream function quibs of the fitted period:
fit_range = (t >= t_initial) & (t <= t_final)

# Do the fit and plot
p = np.polyfit(t[fit_range], y[fit_range], n)
plt.plot(t[fit_range], np.polyval(p, t[fit_range]), 'r-')

# Plot extrapulation:
extrapulate_range = t > t_final
plt.plot(t[extrapulate_range], np.polyval(p, t[extrapulate_range]), 'r:')

# Plot the fit parameters:
a11 = np.array([1, 1])
plt.plot(t_final * a11, [0, np.polyval(p, t_final)], 'k--', lw=1)
plt.plot(t_initial * a11, [0, np.polyval(p, t_initial)], 'k--', lw=1)

# Add the slider for the polynomial degree:
ax = plt.axes([0.3, 0.8, 0.3, 0.03])
Slider(ax=ax, valmin=0, valmax=3, valinit=n, valstep=1, label='degree');
