Graphics quibs
Quibbler easily creates live interactive graphics
Quibs can be used as arguments in most Matplotlib graphics functions, creating graphics quibs - quibs that represents “live”, reactive-interactive, graphics. Indeed, such graphics quibs are bi-directionally linked to their source data. Any changes to upstream quibs are propagated downstream to immediately affect the graphics; and, conversely, user interactions with the graphics (dragging, clicking) is inverse propagated backwards to affect the values of upstream quibs. Combining quibs with widgets and graphics, we can thereby readily create a highly interactive app-like analysis of our data.
Notably, such interactive pipelines are naturally created in Quibbler without us needing to worry about the traditional, and often tedious, programming of specific callback functions for each interactive behavior. Unlike in “regular” programming, where in order to create interactive analysis we need to specifically program callback functions for each graphics object or widget, in Quibbler, we inherently get interactive functionality without requiring us to deal with such what-to-do-if behaviors. Instead, we can set our mind on the analysis from a data-oriented forward-looking standpoint, and let Quibbler deal with any asynchronous graphics or widget events, deciding what needs to change, what needs to re-run, and what to re-plot in order to make things interactive and fun.
Here, to demonstrate the key features of graphics quibs, we will build towards a simple example of building an interactive app for probing the RGB intensities of an image at a chosen point (x,y). This demo extends the simpler demo shown in Quickstart, touching on additional graphics aspects of Quibbler.
Upstream changes automatically refresh downstream graphics quibs
When we apply a Matplotlib graphics function to quib arguments, we get a graphics quib - a quib that creates graphics that automatically refreshes upon upstream changes.
In general, when a quib changes, the values of any downstream dependent quibs are invalidated, but are not immediately recalculated (deferred evaluation). Graphics quibs form an exception to this rule; by default, when graphics quibs are affected by upstream changes, they immediately recalculate, creating live updates to their graphics.
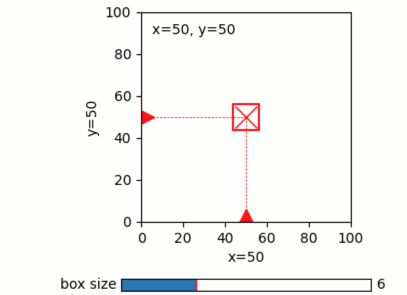
For example, consider the following code for choosing a coordinate x-y:
# Imports
import pyquibbler as qb
from pyquibbler import iquib, q
qb.initialize_quibbler()
import numpy as np
import matplotlib.pyplot as plt
from matplotlib.widgets import Slider

%matplotlib tk
# Figure setup
plt.figure(figsize=(5, 3))
plt.axes([0.25, 0.25, 0.7, 0.7])
plt.axis('square')
plt.axis([0, 100, 0, 100])

# Define x-y coordinates of chosen point:
xy = iquib([50, 50])
x, y = xy

# Plot the point as an 'x' marker:
plt.plot(x, y, 'xr', markersize=16)

# Add text indicating the coordinates of the point:
text_label = q('x={}, y={}'.format, x, y)
plt.text(5, 95, text_label, va='top', ha='left');
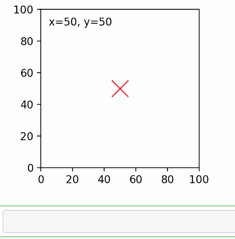
As we see, making an upstream change to the input quib xy, for
example setting xy[1] = 40, refreshes the position of the x-y point
as well as the text, as both of which depend on the function quibs x
and y which depend on xy.
User interactions with graphics are translated into upstream quib assignments
The above example demonstrates how upstream changes affect downstream graphics quibs. Importantly, this relationship can also go backwards: changing the graphics of a graphics quib is translated into assignments to the corresponding upstream quib arguments, and from there, through inverse assignments, to any further upstream quibs.
Such graphics-driven assignments are currently supported for
plt.plot, plt.scatter and for common widgets (see below).
In our point-choosing example code above, moving the marker is
translated into assignments to the arguments of the plot, namely to
assignments to the quibs x and y. Then, as x and y are
function quibs (not allowing overriding; allow_overriding=False by
default for function quibs), these assignments propagate higher
upstream, through inverse-assignments, to xy where they are
ultimately actualized. Any quib graphics that depend on xy, such as
the text message, is then immediately refreshed:
Restricting object dragging horizontally or vertically
In the above example, both the x and y arguments of the plt.plot
function are quibs and thereby Quibbler allows dragging the marker
freely in both the x and y directions. Alternatively, using non-quib
arguments as either x or y, or using quibs that do not allow inverse
assignments (quibs with allow_overriding=False and
assigned_quibs=[]), we can restrict dragging either vertically or
horizontally.
For example, in the code below, we add horizontally and vertically sliding markers for setting the x-y coordinates of our chosen point:
# Add horizontal and vertical guiding lines:
plt.plot([0, x], [y, y], 'r--', linewidth=0.5)
plt.plot([x, x], [0, y], 'r--', linewidth=0.5)

# Add horizontal and vertical draggable markers:
plt.plot(1, y, '>r', markersize=16)
plt.plot(x, 1, '^r', markersize=16);
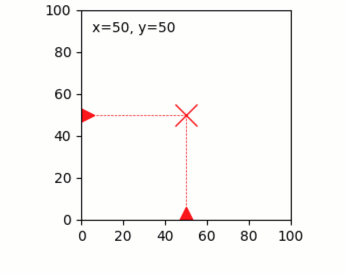
For dragging on more complex paths, see: Dragging graphics along a curved line
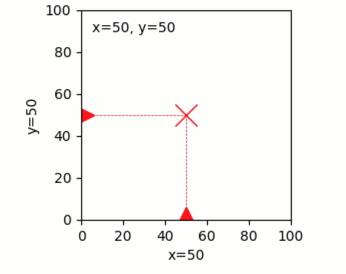
Quiby setters of axis attributes
Using a quib as an argument to a setter of an axis property creates a
graphics quib that sets the property. Thereby, the specified axis
property will automatically refresh upon upstream changes. Such quibly
behavior is supported for diverse axis properties including axis limits
(i.e., set_xlim, set_ylim, plt.xlim, plt.ylim,
plt.axis) axis ticks (set_xticks, set_yticks,
plt.xticks, plt.yticks), axis labels and title (i.e.,
set_xlabel, set_ylabel, set_title, plt.xlabel,
plt.ylabel, plt.title) and other attributes (e.g.,
set_visible, set_facecolor).
As an example, let’s set the x-label and y-label of our
coordinate-choosing axes to indicate the chosen x and y values. These
labels will thereby update automatically as the markers setting xy
are dragged:
plt.xlabel(q('x={}'.format, x))
plt.ylabel(q('y={}'.format, y));
Using quibs with widgets
Quibs can be used as arguments to Matplotlib widget functions, creating bi-directionally linked widget graphics quibs. Like with other graphics quibs, widgets created with quib arguments automatically update upon upstream changes that affect their arguments. In addition, if a given quib is set as the value kwarg of the widget, then interacting with the widget creates graphics-driven assignments to this given quib. This behavior allows to easily create interactive GUIs without a need for the classical, and more cumbersome, use of callback functions.
Here is a list of quib-supported widgets and their corresponding value-setting kwargs:
Slider(valinit=quib, ...)
TextBox(initial=quib, ...)
CheckButtons(actives=quib, ...)
RaioButtons(active=quib, ...)
RectangleSelector(extents=quib, ...)
Note that while normally Matplotlib does not allow specifying
extents as a parameter for RectangleSelector, such specification is
supported in the Quibbler implementation of RectangleSelector.
For example, let’s define a box around our point x-y and create a Slider to control the size of this box:
# Plot a square around the point (x,y):
box_size = iquib(6) # size of the square
plt.plot(x + box_size * np.array([-1, 1, 1, -1, -1]),
         y + box_size * np.array([-1, -1, 1, 1, -1]), 'r-');

# Create a slider to control the box size:
ax = plt.axes([0.35, 0.02, 0.5, 0.04])
Slider(ax=ax, valmin=0, valmax=20, valstep=2, label="box size", valinit=box_size);
Setting Slider(..., valinit=box_size) enables graphics-driven
assignments from the widget to box_size:
Quibbler-based GUI applications
Combining widgets and draggable graphics with quibs allows us to quickly and easily build powerful GUI-like interaction with our data. As an example, we apply below our point-choosing implementation to probe the RGB intensities of an image (here, an image of red, green and blue labeled bacteria growing in a water-in-oil droplet; credit: Einat Tamar, Kishony lab, Technion).
# Load an image from file:
filename = iquib('bacteria_drop.tif')
img = plt.imread(filename)

# Plot the image:
plt.figure(figsize=(6, 4))
ax = plt.axes([0.05, 0.4, 0.5, 0.5])
ax.imshow(img, origin='lower');
plt.setp(ax, xticks=[], yticks=[])

# Define x-y coordinates of chosen point:
xy = iquib([50, 50])
x, y = xy

# Plot the point as a white marker.
ax.plot(x, y, 'xw', markersize=12)

# Add text indicating the coordinates of the point:
text_label = q('x={}, y={}'.format, x, y)
ax.text(5, 95, text_label, va='top', ha='left', color='w');

# Add horizontal and vertical guiding lines:
ax.plot([0, x], [y, y], 'w--', linewidth=0.5)
ax.plot([x, x], [0, y], 'w--', linewidth=0.5)

# Add horizontal and vertical draggable markers:
ax.plot(1, y, '>w', markersize=16)
ax.plot(x, 1, '^w', markersize=16);

# Plot a square around the point (x,y):
box_size = iquib(6) # size of the square
plt.plot(x + box_size * np.array([-1, 1, 1, -1, -1]),
         y + box_size * np.array([-1, -1, 1, 1, -1]), 'w-');

# Create a slider to control the box size:
ax = plt.axes([0.15, 0.08, 0.3, 0.05])
Slider(ax=ax, valmin=0, valmax=20, valstep=2, label="box size", valinit=box_size);

# Cut and plot the boxed image:
img_cut = img[y - box_size : y + box_size + 1, x - box_size : x + box_size + 1, :]
ax = plt.axes([0.6, 0.08, 0.3, 0.2])
ax.imshow(img_cut, origin='lower');
ax.plot(x - (x - box_size), y - (y - box_size), 'xw', markersize=12)
ax.axis([-0.5, 2 * box_size + 0.5, -0.5, 2 * box_size + 0.5])
plt.setp(ax, xticks=[], yticks=[])

# Plot the RGB of the image at the chosen point:
rgb_point = img[y, x, :]
ax = plt.axes([0.6, 0.4, 0.3, 0.5])
ax.bar(['Red', 'Green', 'Blue'], rgb_point, color=list('rgb'));
ax.set_ylim([0, 255])
ax.set_ylabel('Intensity');
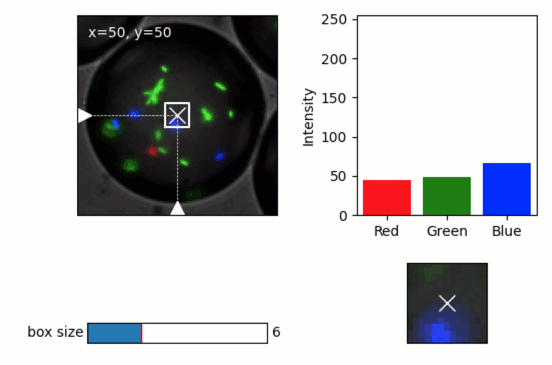
A few notes on the above implementation. Beyond the use of draggable markers and widgets demoed in the introduction above, we also use here the following features:
The plot of the box allows dragging the box leading to assignment into the
xandyquibs (as they are specified as the first argument in the+operator, see Assignments).Using a quiby setter of the axis limits (
ax.axis([-0.5, 2 * box_size + 0.5, -0.5, 2 * box_size + 0.5])) dynamically changes the axis to fit the cut image as its size grows or shrinks.Plotting the x-marker in at the center of the cut image, we shift to new coordinates
x - (x - box_size), y - (y - box_size)thereby allowing dragging of this x-marker to affectxandy(the marker stays in place as expected since its dependence onxandycancels out)
Graphics refresh mode
For computationally heavy calculations, we might prefer to disable
immediate recalculation for graphics quibs. To define for each quib
under what conditions it should be refreshed, see the
graphics_update property and the central
refresh_graphics() function.