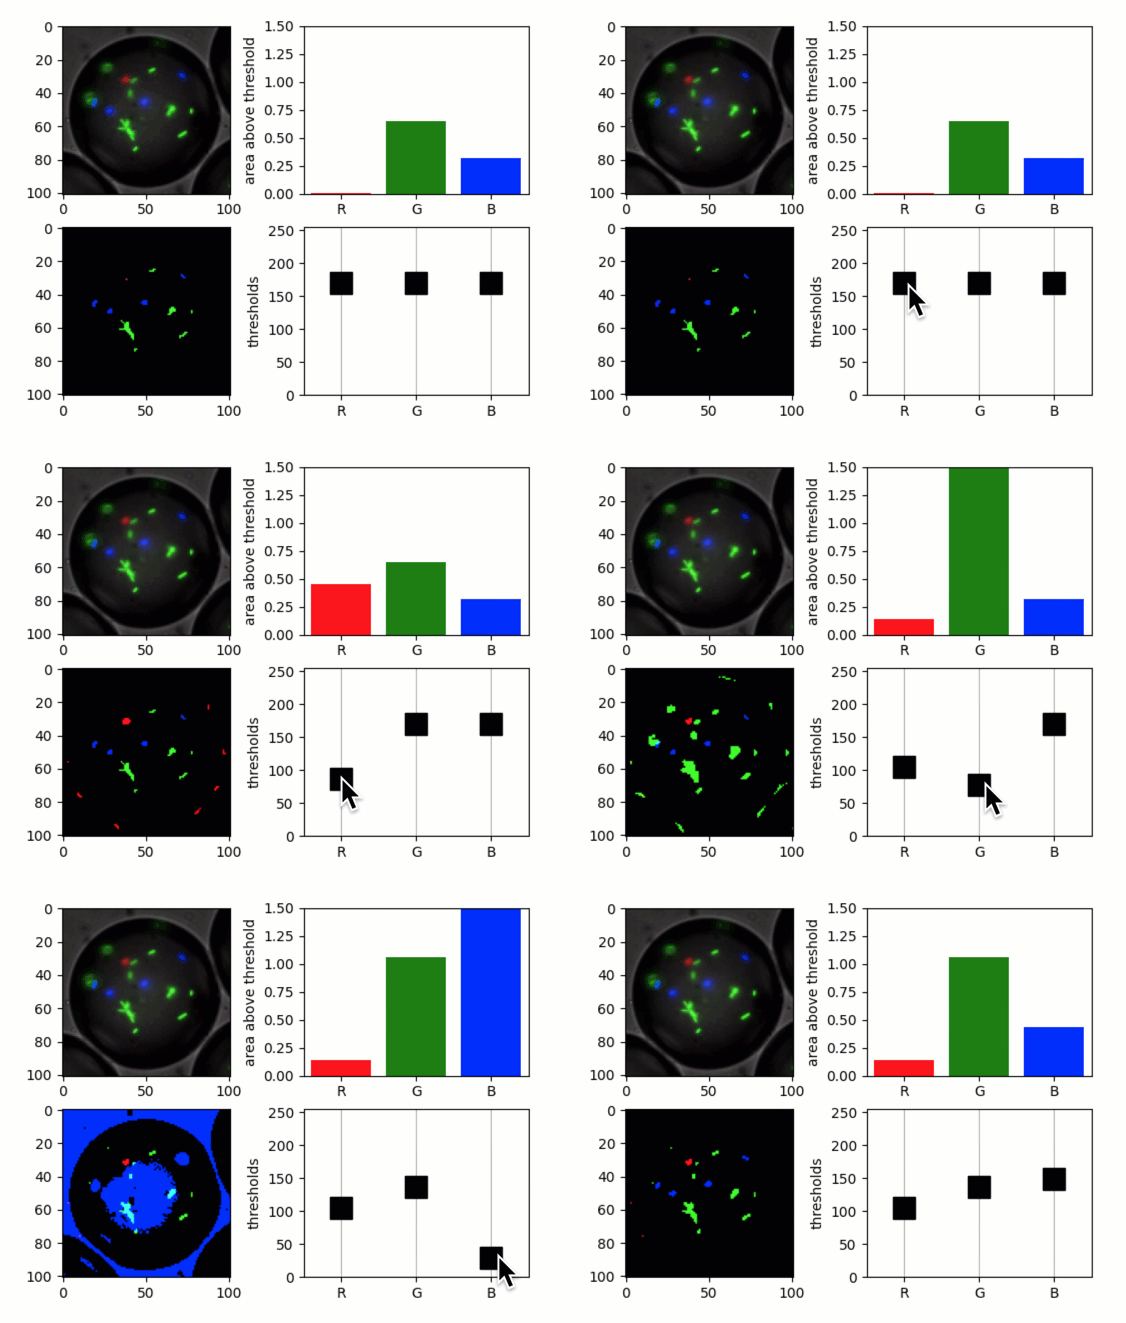
Simple quib-app for image thresholding
A simple demo of a quib-based GUI for thresholding an image.
Features
Graphics quibs
Graphics-driven assignments
Inverse assignments
Try me
Try dragging the RGB threshold values.
from pyquibbler import iquib, initialize_quibbler
initialize_quibbler()
import matplotlib.pyplot as plt
import numpy as np
%matplotlib tk
# Load an image:
filename = iquib('bacteria_drop.tif')
img = plt.imread(filename)

# Show the image:
plt.figure()
ax = plt.subplot(2, 2, 1)
ax.imshow(img);
# Threshold each of the RGB channels:
thresholds_rgb = iquib([170, 170, 170])
# Plot the thresholds
ax = plt.subplot(2, 2, 4)
ax.axis([-0.5, 2.5, 0, 255])
ax.xaxis.grid(True)
rgb = list('RGB')
ax.plot(rgb, thresholds_rgb, 'sk', markersize=16);
ax.set_ylabel('thresholds');
# Calculate and plot the thresholded image:
img01 = img > np.expand_dims(thresholds_rgb, axis=(0, 1))
plt.subplot(2, 2, 3)
plt.imshow(img01 * 1.);
# Calculate area above threshold for each color:
fraction_above_threshold = np.average(img01, (0, 1))

# Plot detected areas:
ax = plt.subplot(2, 2, 2)
ax.bar(rgb, fraction_above_threshold * 100, color=list('rgb'))
ax.axis([-0.5, 2.5, 0, 1.5])
ax.set_ylabel('area above threshold');
# Show thresholds on log scale:
log_thresholds_rgb = np.log2(thresholds_rgb)

fg = plt.figure(figsize=(4, 3))
ax = fg.gca()
ax.plot(rgb, log_thresholds_rgb, 'sk', markersize=16)
ax.axis([-0.5, 2.5, 0, 8])
ax.xaxis.grid(True)
