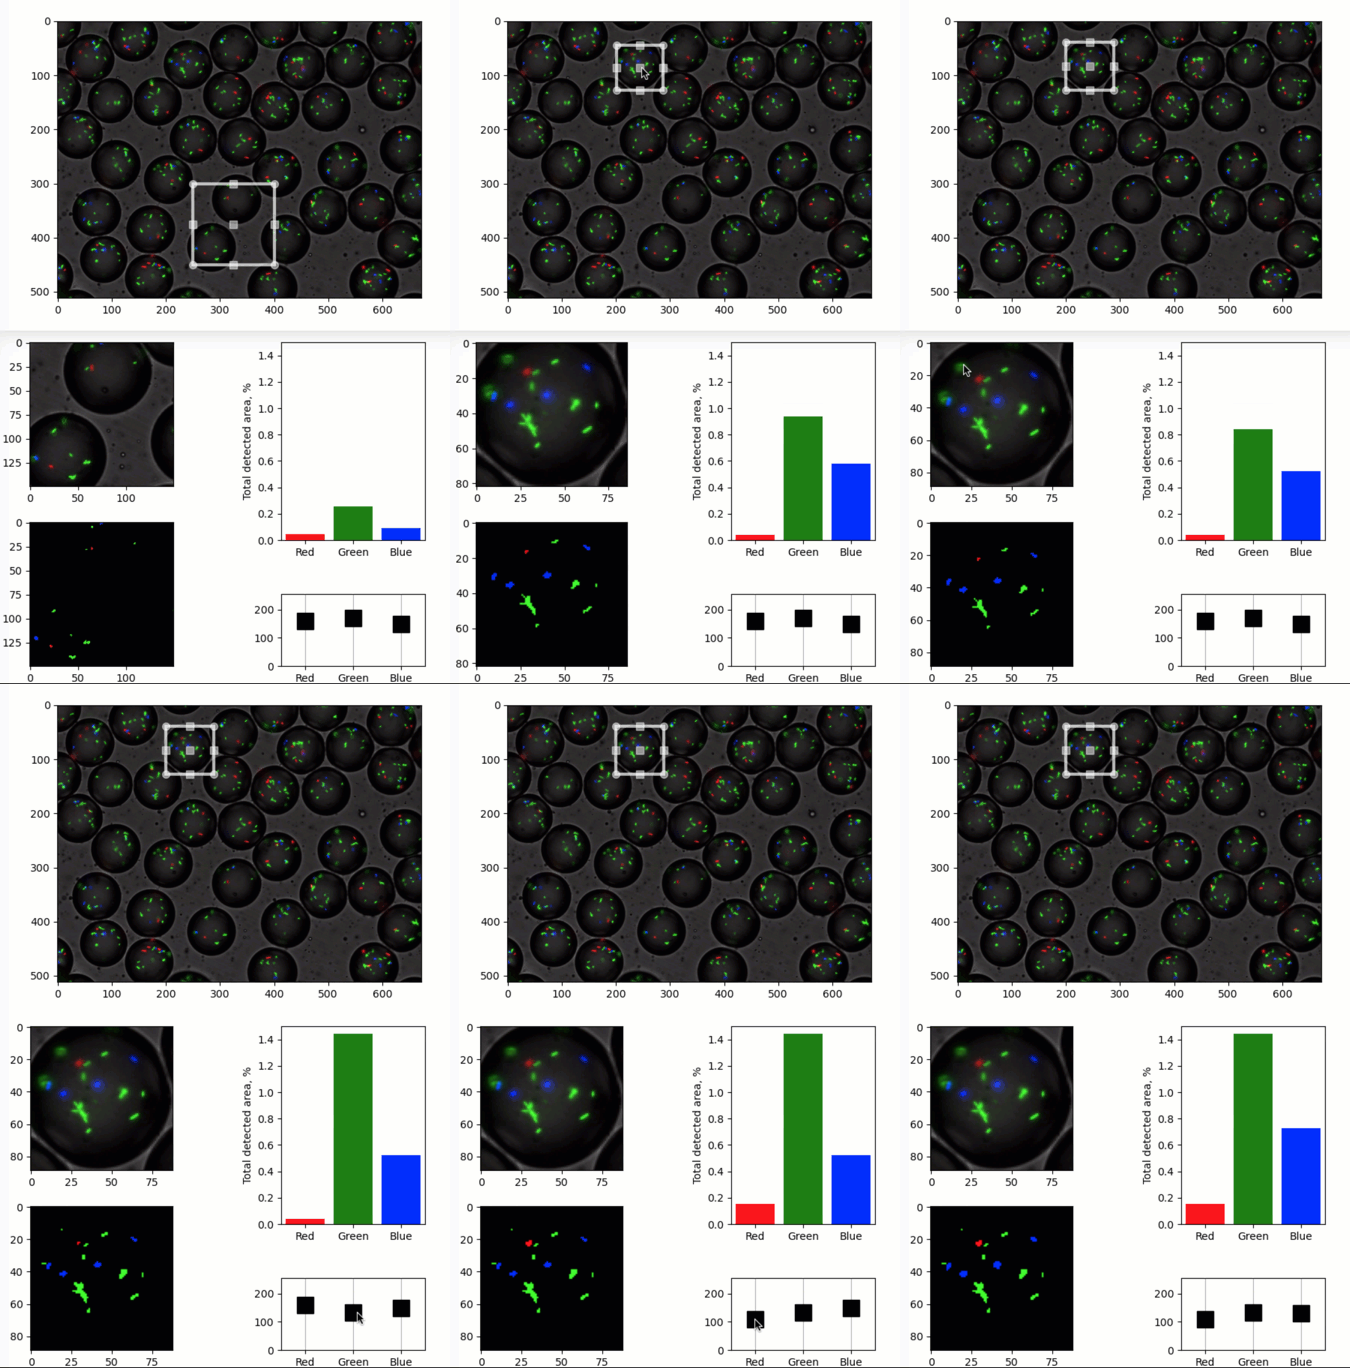
Interactive image cutting and thresholding
A simple demo of a quib-based GUI.
Features
Graphics quibs
Graphics-driven assignments
Inverse assignments
Matplotlib widgets with quibs
Try me
Try dragging/resizing the Region of Interest (ROI) in the main image.
Try dragging/resizing the rectangle around the cut image in the second figure.
Try moving the thresholds.
from pyquibbler import iquib, initialize_quibbler
initialize_quibbler()
import matplotlib.pyplot as plt
from matplotlib.widgets import RectangleSelector
import numpy as np
%matplotlib tk
# Load an image:
filename = iquib('bacteria_in_droplets.tif')
img_main = plt.imread(filename);
# Show the image:
plt.figure()
ax = plt.gca()
ax.imshow(img_main);
# Define and plot a rectangle Region Of Interest (ROI)
ROI = iquib(np.array([250, 400, 300, 450]))
rectprops = dict(edgecolor='w', alpha=0.7, fill=False, linewidth=3)
RectangleSelector(ax, extents=ROI, rectprops=rectprops);
# Cut the ROI from the main image:
img_cut = img_main[ROI[2]:ROI[3], ROI[0]:ROI[1], :]

# Plot the cut image:
fig2 = plt.figure()
ax_cut = fig2.add_axes([0.05, 0.55, 0.35, 0.4])
ax_cut.imshow(img_cut);
# Threshold each of the RGB channels:
thresholds_rgb = iquib(np.array([160, 170, 150])) # <-- input: RGB thresholds
img_cut01 = img_cut > np.reshape(thresholds_rgb,(1, 1, 3))

# Plot the thresholded image:
ax_cut01 = fig2.add_axes([0.05, 0.05, 0.35, 0.4])
ax_cut01.imshow(img_cut01 * 1.);
# Calculate area above threshold for each color:
fraction_above_threshold = np.average(img_cut01, (0, 1))

# Plot detected areas:
ax_area = fig2.add_axes([0.6, 0.4, 0.3, 0.55])
rgb = ['Red', 'Green', 'Blue']
ax_area.bar(rgb, fraction_above_threshold * 100, color=list('rgb'))
ax_area.axis([-0.5, 2.5, 0, 1.5])
ax_area.set_ylabel('Total detected area, %');
# Threshold controls
ax_thr = fig2.add_axes([0.6, 0.05, 0.3, 0.2])
ax_thr.axis([-0.5, 2.5, 0, 255])
ax_thr.xaxis.grid(True)
ax_thr.plot(rgb, thresholds_rgb, 'sk', markersize=16, markerfacecolor='k');
# Add a "draggable" rectangle ROI around the extracted image:
shifted_ROI = ROI - ROI[[0, 0, 2, 2]]
shrinked_shifted_ROI = shifted_ROI + [7, -7, +7, -7]
RectangleSelector(ax_cut, extents=shrinked_shifted_ROI, rectprops=rectprops);
