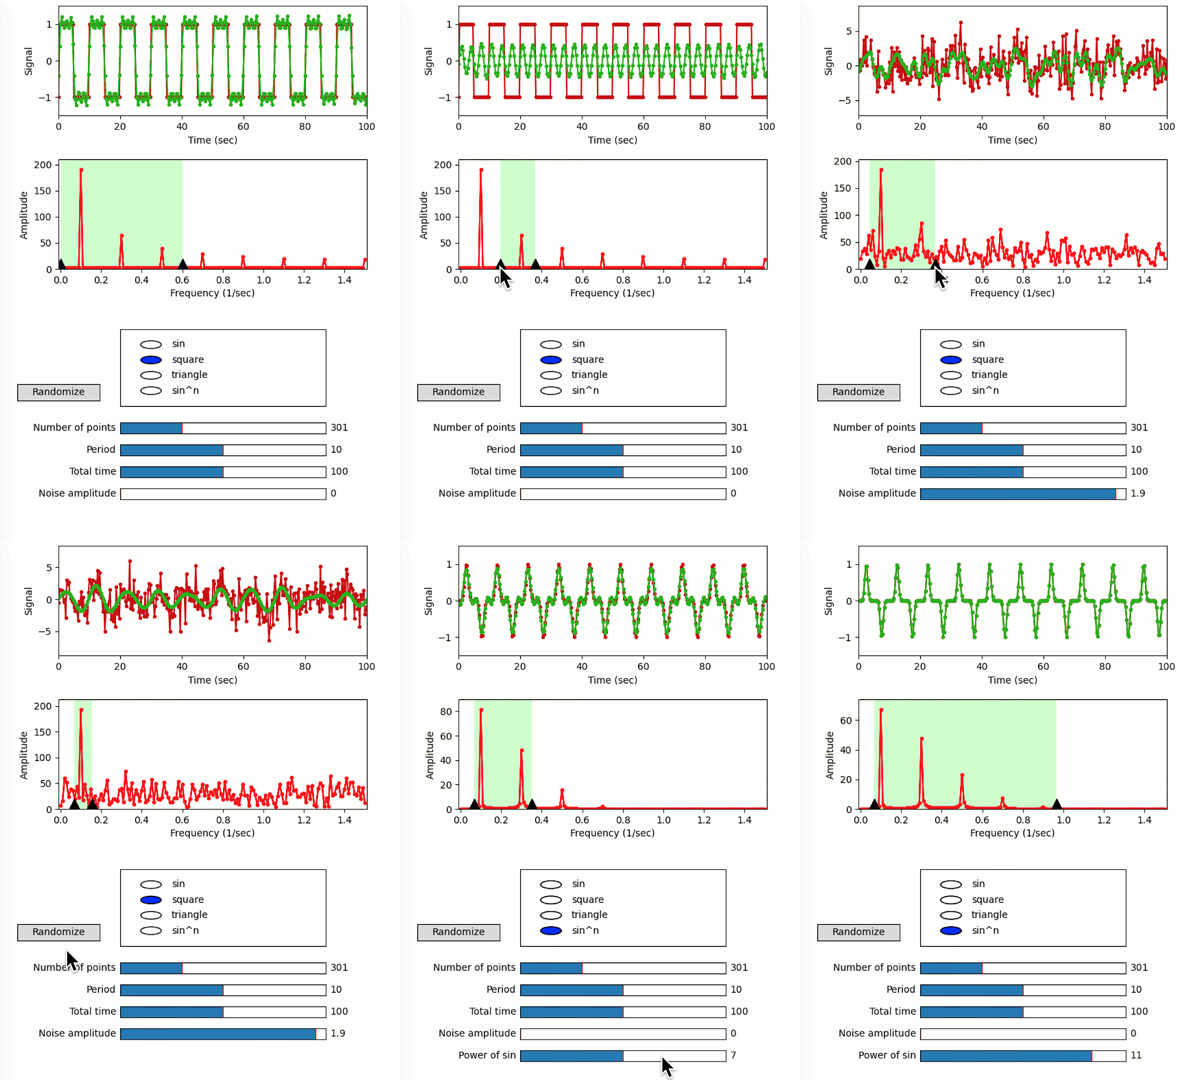
Signal analysis with random noise
A demo of a quib-based GUI for signal analysis.
Features
Random quibs
Graphics-driven assignments
Inverse assignments
Linking quibs with matplotlib.widgets: Slider, RadioButtons
Try me
Try dragging the triangle markers to specify the band-width.
Try playing with the sliders, or specifying a different function with the radio buttons.
from pyquibbler import iquib, initialize_quibbler, q, \
    quiby, reset_random_quibs
import numpy as np
import matplotlib.pyplot as plt
import matplotlib.patches as patches
from matplotlib import widgets
from matplotlib.patches import Rectangle
initialize_quibbler()
%matplotlib tk
# Total time (sec):
total_time = iquib(100)

# Number of time points (limited to even numbers between 0 and 1000):
num_time_points = iquib(300).setp(assignment_template=(0, 1000, 2))

# Time vector:
t = np.linspace(0, total_time,num_time_points)

# Period (sec):
period = iquib(10)
w = 2 * np.pi / period

# Type of functions:
nSin = iquib(3).setp(assignment_template=(1, 13, 2))
signal_fnc_list = ['sin', 'square', 'triangle', 'sin^n']
signal_fnc_chosen = iquib(1)

# Signal as a function of time:
@quiby
def get_signal(t, w, chosen, power):
    return {0: lambda s, n: s,
            1: lambda s, n: (s > 0) * 2 - 1,
            2: lambda s, n: np.arcsin(s),
            3: lambda s, n: s ** n}[chosen](np.sin(w * t), power)

signal = get_signal(t, w, signal_fnc_chosen, nSin)

# Add Noise:
noise_amp = iquib(0.0)
noise = noise_amp * np.random.randn(num_time_points)

measurement = signal + noise

# Bandwidth:
min_freq = iquib(0.0)
max_freq = iquib(0.6)

# FFT:
spectrum = q(np.fft.fft, measurement)
dfreqs = 1/total_time  # Frequency resolution
freqs = np.concatenate([
    np.arange(0, (num_time_points - 1) / 2),
    np.arange(num_time_points / 2, 0, -1)]) * dfreqs  # Frequency vector

# Apply band filter
spectrum_filtered = spectrum * ((freqs>=min_freq) & (freqs<=max_freq))

# Inverse FFT:
S0 = q(np.fft.ifft, spectrum_filtered);
# figure setup:
fig = plt.figure(1, figsize=(6, 8))
# signal vs time
ax1 = fig.add_axes((0.15, 0.78, 0.75, 0.2))
ax1.set_ylim([np.min(measurement) - 0.5 - noise_amp,
               np.max(measurement) + 0.5 + noise_amp])
ax1.set_xlim([0, total_time])
ax1.set_xlabel('Time (sec)')
ax1.set_ylabel('Signal')
ax1.plot(t,np.real(measurement), '.-', color=[0.8, 0, 0])
ax1.plot(t,np.real(S0), '.-', color=[0, 0.7, 0]);
# spectrum
ax2 = fig.add_axes((0.15, 0.5, 0.75, 0.2))
yl = np.max(np.abs(spectrum)) * 1.1
ax2.axis([-dfreqs, np.max(freqs) + dfreqs, 0, yl])
ax2.set_xlabel('Frequency (1/sec)')
ax2.set_ylabel('Amplitude')
ax2.plot(freqs, np.abs(spectrum), 'r.-')
width = max_freq - min_freq
band = Rectangle((min_freq, 0), width, yl, facecolor=(0.8, 1, 0.8))
ax2.add_patch(band)
ax2.plot(min_freq, 0, 'k^', markersize=22)
ax2.plot(max_freq, 0, 'k^', markersize=22);
# sliders of quibs:
slider_axs = [fig.add_axes([0.3, 0.2-i*0.04, 0.5, 0.02]) for i in range(5)]
for i, label, valmin, valmax, valstep, valinit in (
    (0, 'Number of points', 1, 1000, 2, num_time_points),
    (1, 'Period', 0, 20, 1, period),
    (2, 'Total time', 0, 200, 5, total_time),
    (3, 'Noise amplitude', 0, 2, 0.1, noise_amp),
    (4, 'Power of sin', 1, 13, 1, nSin)):
    widgets.Slider(ax=slider_axs[i], label=label, valmin=valmin,
                   valmax=valmax, valstep=valstep, valinit=valinit)
# Make the 'Power of sin' slider visible only when signal_fnc_chosen==3:
is_sinN = q(lambda x: x==3, signal_fnc_chosen)
a = slider_axs[4].set_visible(is_sinN);
# radio buttons to choose function:
axs_radio = fig.add_axes([0.3, 0.25, 0.5, 0.14])
btns = widgets.RadioButtons(
    ax=axs_radio, labels=signal_fnc_list, active=signal_fnc_chosen)
# Randomization button
randomize_button = widgets.Button(
    ax=fig.add_axes([0.05, 0.26, 0.2, 0.03], xticks=[], yticks=[]),
    label='Randomize')
randomize_button.on_clicked(lambda x: reset_random_quibs());
