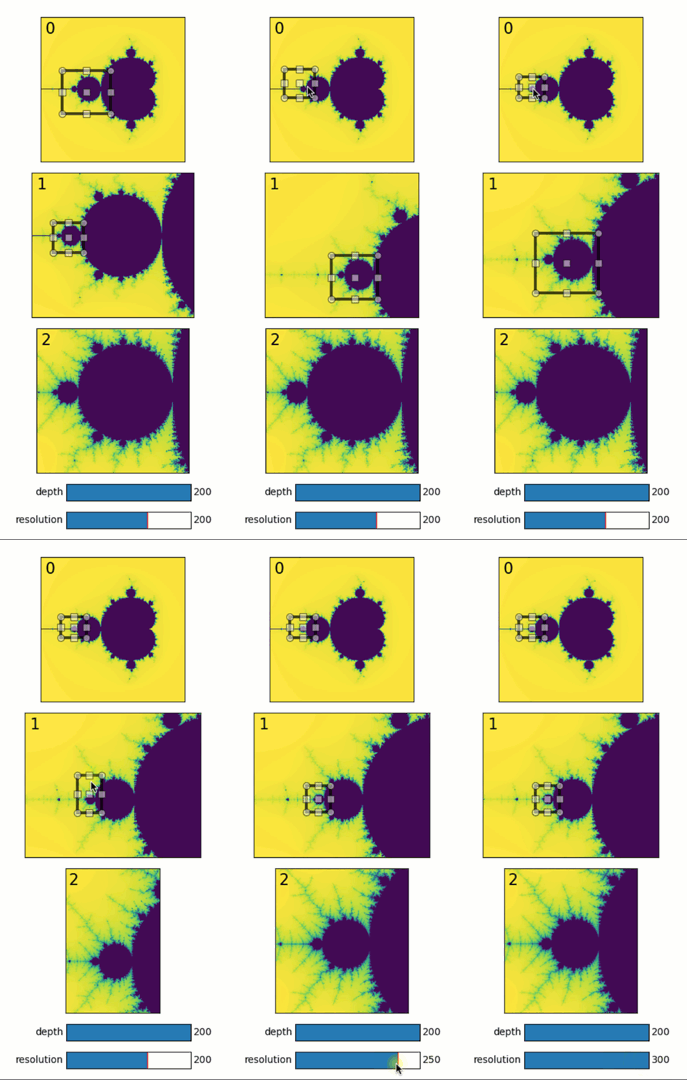
Interactive zooming on Mandelbrot
Simple quib-based app for viewing and zooming on the Mandelbrot set.
Features
Calling a user-defined function
Quib-linked widgets
Inverse assignments
Try me
Try moving the region-of-interests in panels 1 and 2 to choose zoom-in areas.
from pyquibbler import iquib, initialize_quibbler, q
initialize_quibbler()
import matplotlib.pyplot as plt
from matplotlib.widgets import RectangleSelector, Slider
import numpy as np

%matplotlib tk
def mandelbrot(extent, num_pixels=200, num_iterations=30):
    '''
    calculate mandelbrot set in the extent range
    extent = [xmin, xmax, ymin, ymax]
    '''

    x_range = extent[0:2]
    y_range = extent[2:4]

    dx = np.diff(x_range)
    dy = np.diff(y_range)
    d = np.maximum(dx,dy) / num_pixels
    xy = np.mgrid[y_range[0]:y_range[1]:d, x_range[0]:x_range[1]:d]
    y, x = xy
    c = x + 1j * y
    z = np.zeros(np.shape(x))
    m = np.zeros(np.shape(x))

    import warnings
    warnings.filterwarnings("ignore")
    for i_iter in range(num_iterations):
        z = z*z + c
        m[(np.abs(z) > 2) & (m == 0)] = num_iterations - i_iter
    warnings.filterwarnings("default")
    m = np.flipud(m)

    return m
# Define input quibs:

# image resolution:
resolution = iquib(200)

# number of iterations for calculating convergence of the
# Mandelbrot set:
depth = iquib(200)

# selection areas for each of the panels:
XYs = []
XYs.append(iquib(np.array([-2.   ,  1.  , -1.5, 1.5  ])))
XYs.append(iquib(np.array([-1.55 , -0.55, -0.5, 0.39 ])))
XYs.append(iquib(np.array([-1.42 , -1.23, -0.1, 0.08 ])))

# Figure setup:
fig = plt.figure(figsize=(4.5,8))

for k in range(3):
    # Define a functional quib that calculates Mandelbrot:
    img = q(mandelbrot,XYs[k], resolution, depth)

    # Plot the image:
    axs = fig.add_axes([0.1, 0.13 + (2-k) * 0.28, 0.8, 0.26])
    axs.imshow(img, extent=XYs[k])
    axs.set_xticks([])
    axs.set_yticks([])
    axs.text(0.03,0.97,str(k), transform = axs.transAxes,
             fontsize=16, va='top',ha='left')

    # ROI selector:
    if k<2:
        RectangleSelector(axs, extents=XYs[k+1],
            props=dict(edgecolor='black', alpha=0.7, fill=False, linewidth=3))

# plot the depth slider
axs = fig.add_axes([0.35,0.08,0.4,0.03])
Slider(ax=axs, label='depth', valmin=0, valmax=200, valstep=1,
       valinit=depth);

# plot the resolution slider
axs = fig.add_axes([0.35,0.03,0.4,0.03])
Slider(ax=axs, label='resolution', valmin=10, valmax=300, valstep=10,
       valinit=resolution);
