Quiby ipywidgets
Quibs can easily connect with ipywidgets
Quibs can be used as arguments in ipywidgets, creating “quiby widgets” that are bi-directionally to their quib arguments. Any change to upstream quibs is propagated downstream to affect the widgets; and, conversely, user interactions with the widgets is inverse propagated backwards to affect the values of upstream quibs. Combining quibs with ipywidgets and graphics, we can thereby readily and easily create interactive app-like analysis of our data.
Imports
from pyquibbler import iquib, initialize_quibbler
initialize_quibbler()

import ipywidgets as ipyw
Using quibs as arguments in ipywidgets creates quiby widgets
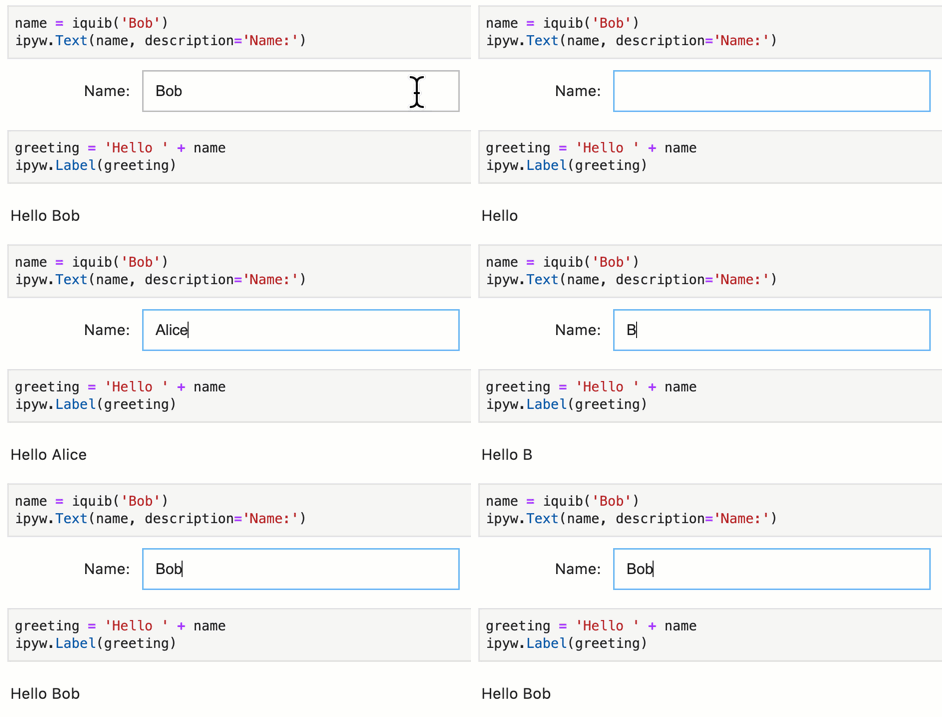
When we execute an ipywidget function with quib arguments, we get a quiby widget - a widget that is bi-directionally linked to the value of the quib. Setting the widget affect the value of the quib and changing the quib value affects the widget.
For example:

As the quib changes, any downstream quibs, graphics and widgets will also be affected.
For example:
Quibs allows functional link between widget
We often want to link the trait values of different quibs (for example,
representing a value as a fraction in one widget or as percent in
another widget). While in ipywidgets, widget traits can be linked
using ipywidgets.jslink, creating functional relationships between
traits requires implementing “observe” callback functions which are
called when a trait value changes and which implement functional
conversions from a given widget trait to another. Using Quibbler, in
contrast, widgets that use dependent quibs become inherently linked; we
do not need to worry about linking or about specify any what-to-do-if
callback functions.
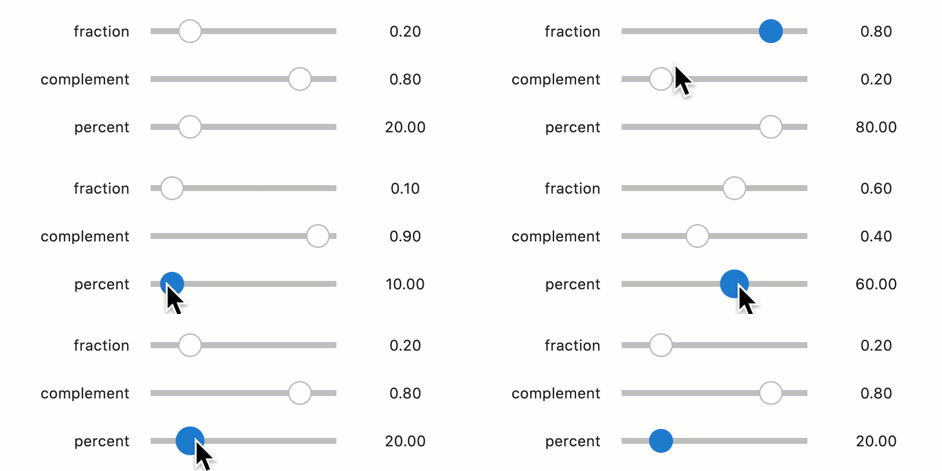
As a simple example, compare the “standard” and “quiby” implementations of a code which creates three connected widgets representing a given value as a ‘fraction’, as a complement of that fraction (complement = 1 - fraction) and as a percent (percent = fraction * 100):
Linking widgets: the “standard” way
Normally, without using quibs, to link our ‘fraction’, ‘complement’ and ‘percent’, we need to implement callback functions that transform new values of each of these traits to their corresponding values in the other traits. Our code will look something like that:
fraction_widget = ipyw.FloatSlider(0.2, min=0, max=1, step=0.05, description='fraction')
complement_widget = ipyw.FloatSlider(0.8, min=0, max=1, step=0.05, description='complement')
percent_widget = ipyw.FloatSlider(20, min=0, max=100, step=5, description='percent')

def on_fraction_change(changes):
    percent_widget.value = changes['new'] * 100
    complement_widget.value = 1 - changes['new']

def on_complement_change(changes):
    fraction_widget.value = 1 - changes['new']

def on_percent_change(changes):
    fraction_widget.value = changes['new'] / 100

fraction_widget.observe(on_fraction_change, 'value')
complement_widget.observe(on_complement_change, 'value')
percent_widget.observe(on_percent_change, 'value')

ipyw.VBox([fraction_widget, complement_widget, percent_widget])
Linking widgets: the “quiby” way
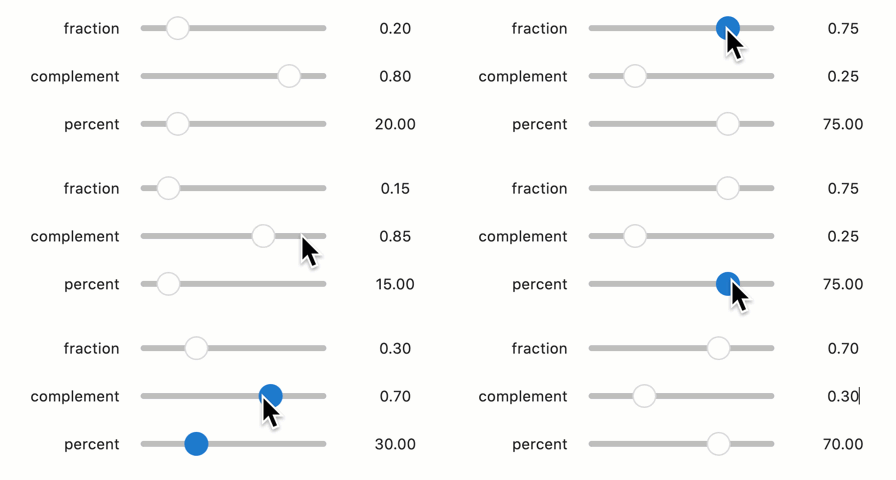
In contrast with the cumbersome code above, implementing these same widgets with quibs, we do not need to worry about callback functions; multiple widgets that depend on the same quib are all inherently linked. We can therefore get the same functionality as above with a much simpler code:
fraction = iquib(0.2)
ipyw.VBox([ipyw.FloatSlider(fraction, min=0, max=1, step=0.05, description='fraction'),
           ipyw.FloatSlider(1 - fraction, min=0, max=1, step=0.05, description='complement'),
           ipyw.FloatSlider(fraction * 100, min=0, max=100, step=5, description='percent')])
Any widget trait can be a quib
Quibs can be used as arguments not only for the ‘value’ of an ipywidget, but also for any other traits, making these traits dynamically dependent on the quib’s value.
For example, we can set the min and the max of a Slider according to the values of a quib that are set in another slider:
Quibs can be used as arguments not only for the ‘value’ of an ipywidget, but also for other traits, making these traits dependent on the quib’s value.
For example, we can set the min and max of a Slider according to the values of a quib that are set in another slider:
min_max = iquib([0, 100])
value = iquib(20)
ipyw.VBox([
    ipyw.IntRangeSlider(value=min_max),
    ipyw.IntSlider(value=value, min=min_max[0], max=min_max[1]),
])

Quibbler-based GUI applications
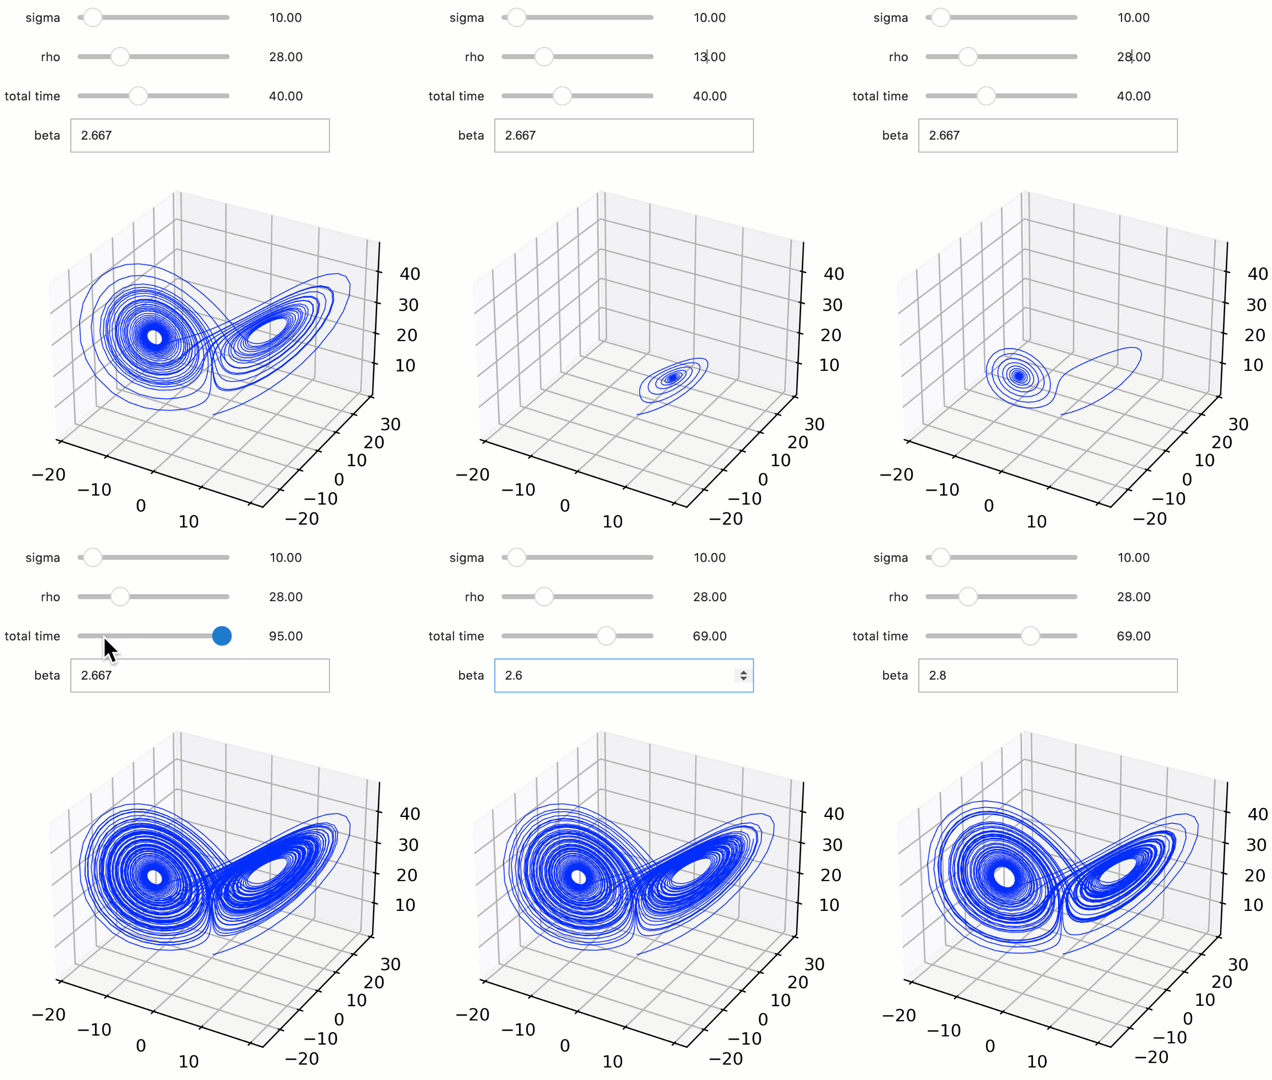
Combining ipywidgets and graphics with quibs allows us to quickly build interactive applications.
As an example, consider an app to allow playing with the parameters of an ODE solver. In particular, we implement here an app for solving the Lorenz equations:
%matplotlib widget

import pyquibbler as qb
from pyquibbler import iquib, quiby
qb.initialize_quibbler()

import ipywidgets as ipyw
import numpy as np
from scipy.integrate import solve_ivp
import matplotlib.pyplot as plt


@quiby
def solve_lorenz(y0, t_final, s, r, b):

    def lorenz_dydt(t, y):

        xp = s*(y[1] - y[0])
        yp = y[0] * (r - y[2]) - y[1]
        zp = y[0]*y[1] - b*y[2]

        return np.asarray([xp, yp, zp])

    return solve_ivp(lorenz_dydt, [0, t_final], y0, method='RK45', rtol=1e-6)

# Define parameters
sigma = iquib(10.)
rho = iquib(28.)
beta = iquib(2.667)

t_final = iquib(40)
y0 = iquib([.2, .3, .4])

# solve the ODEs
sol = solve_lorenz(y0, t_final, sigma, rho, beta)
y = sol['y']

# plot solution
output = ipyw.Output()
with output:
    fig = plt.figure(figsize=(4, 3))
    fig.canvas.toolbar_visible = False
    fig.canvas.header_visible = False
    fig.canvas.footer_visible = False
    fig.canvas.toolbar_visible = False
    fig.canvas.header_visible = False
    fig.canvas.resizable = False
    ax = plt.axes([0, 0, 1, 1], projection='3d')
    ax.plot3D(y[0], y[1], y[2], 'blue', linewidth=0.5);
    plt.show()
widgets = ipyw.VBox([
    ipyw.FloatSlider(sigma, description='sigma'),
    ipyw.FloatSlider(rho, description='rho'),
    ipyw.FloatSlider(beta, description='beta'),
    ipyw.FloatSlider(t_final, description='total time'),
])
ipyw.HBox([widgets, output])
