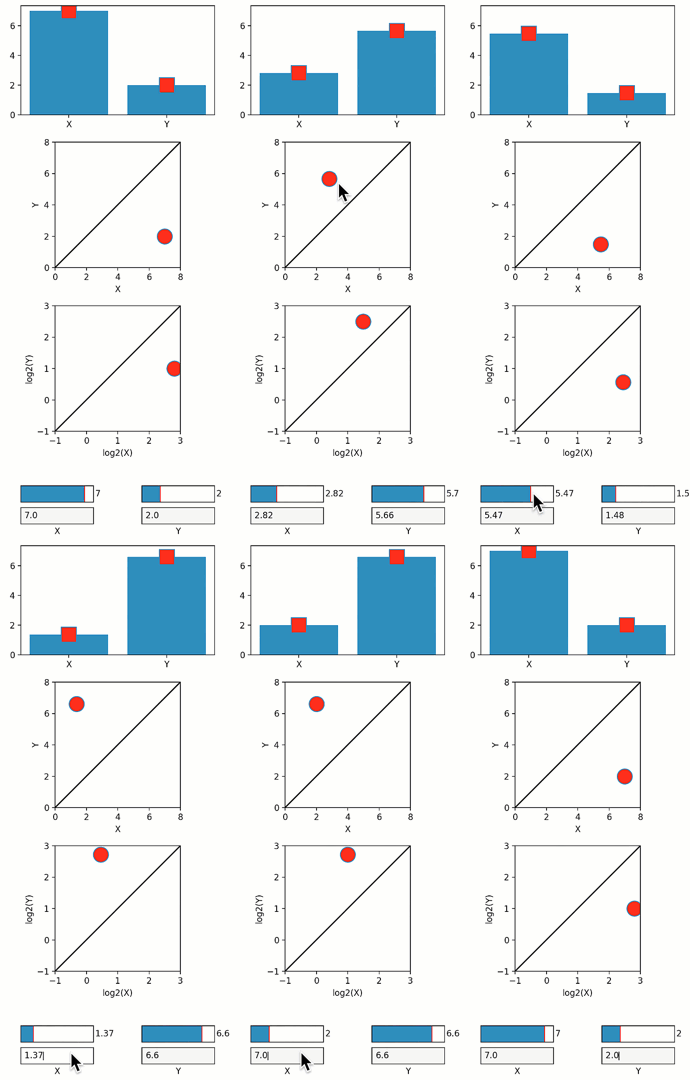
Same variable in different co-adjusting graphical representations
In data analysis, we often want to represent the same variable in different graphical forms, and/or following different arithmetic transformations (for example, representing the same threshold value in both linear and log scales). As these different presentations represent different transformations of the same value, we would want that a change in any one of them will automatically affect the others.
In Quibbler, a change to any one of the graphical presentations of a variable is propagated backwards to the source variable, typically an iquib, thereby automatically affecting all representations.
In the current example, the same data X,Y is represented in different graphical forms. Changing any one of these representations changes all the others accordingly.
Features
Graphics quibs
Quib-linked widgets
Graphics-driven assignments
Inverse assignments
Try me:
Dragging the square markers in the top panel
Dragging the circle markers in the linear or log scale panels
Adjusting the sliders
Entering a new value in the text boxes (not currently implemented)
from pyquibbler import iquib, initialize_quibbler, q
initialize_quibbler()
import matplotlib.pyplot as plt
from matplotlib.widgets import TextBox, Slider
import numpy as np
%matplotlib tk
# Figure setup:
fig = plt.figure(figsize=(4, 9))

axs1 = fig.add_axes([0.1, 0.78, 0.8, 0.2])
axs2 = fig.add_axes([0.1, 0.50, 0.8, 0.23])
axs3 = fig.add_axes([0.1, 0.20, 0.8, 0.23])

axs2.axis('square')
lim2 = iquib([0, 8])
axs2.set_xlim(lim2)
axs2.set_ylim(lim2)
axs2.set_xlabel('X')
axs2.set_ylabel('Y')
axs2.plot(lim2, lim2, 'k-')

axs3.axis('square')
lim3 = iquib([-1, 3])
axs3.set_xlim(lim3)
axs3.set_ylim(lim3)
axs3.set_xlabel('log2(X)')
axs3.set_ylabel('log2(Y)')
axs3.plot(lim3, lim3, 'k-')

axs_slider_x = fig.add_axes([0.1, 0.07, 0.3, 0.03])
axs_slider_y = fig.add_axes([0.6, 0.07, 0.3, 0.03])

axs_txt_x = fig.add_axes([0.1, 0.03, 0.3, 0.03])
axs_txt_y = fig.add_axes([0.6, 0.03, 0.3, 0.03])
axs_txt_x.set_xlabel('X')
axs_txt_y.set_xlabel('Y');
# Define an input quib XY, representing X-Y coordinates:
xy = iquib([7., 2.])
x, y = xy;
# Present the same data in multiple co-adjusting graphical objects.
# Changing any one of the representaiotn will propagate backwards to change to
# the iquib xy, thereby affecting all other representations.

# (1) Bar representation:
axs1.bar(['X', 'Y'], xy) # Bars

# (2) Point above bars:
marker_props = {'markersize': 18, 'markerfacecolor': 'r'}
axs1.plot(xy, 's', **marker_props)

# (3) X-Y representation in linear scale:
axs2.plot(x, y, marker='o', **marker_props)

# (4) X-Y representation in log scale:
axs3.plot(np.log2(x), np.log2(y), 'o', **marker_props)

# (5) Text representation:
axs2.text(0.05, 0.85, q('X={:.2f}, Y={:.2f}'.format, x, y),
          transform = axs3.transAxes, fontsize=12)

# (6) TextBox
TextBox(ax=axs_txt_x, label=None, initial=x)
TextBox(ax=axs_txt_y, label=None, initial=y)

# (7) Sliders
Slider(ax=axs_slider_x, label=None, valmin=0, valmax=8, valstep=None, valinit=x)
Slider(ax=axs_slider_y, label=None, valmin=0, valmax=8, valstep=0.1, valinit=y);
