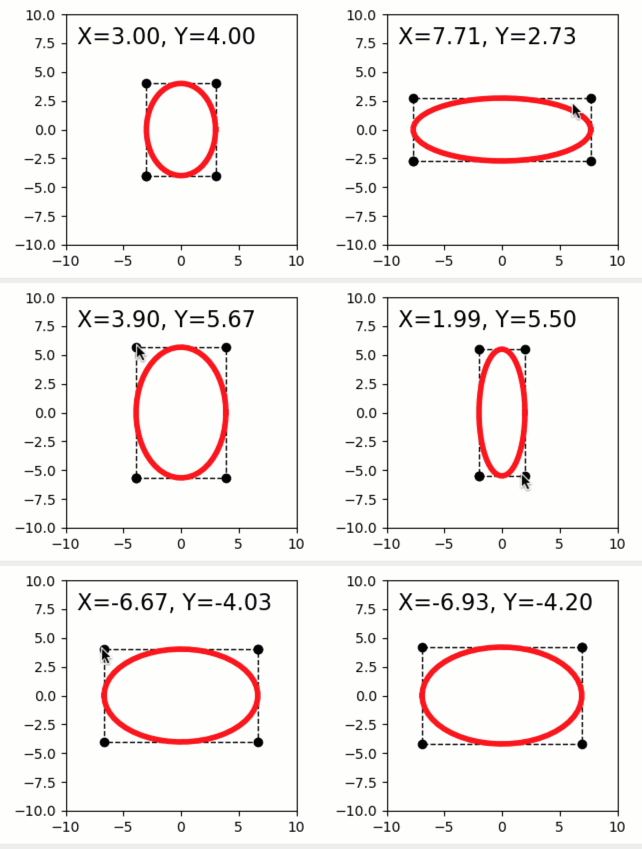
Dragging graphics affects upstream quibs
A simple demo of interactive graphics-driven assignments.
Features:
Graphics quibs
Graphics-driven assignments
Inverse assignments
Try me:
Try dragging the red marker; note the change in X,Y text, square, ellipse.
from pyquibbler import iquib, initialize_quibbler, q
import matplotlib.pyplot as plt
import numpy as np
initialize_quibbler()
%matplotlib tk
# Figure setup:
fig1 = plt.figure(figsize=(4, 3))
plt.axis('square')
plt.axis([-10, 10, -10, 10]);
# Define input quibs for x-y coordinates:
xy = iquib(np.array([3., 4.]))
x, y = xy
# Plot additional graphics based on x and y.
# these downstream graphics will change when the marker is moved:

# Text:
plt.text(-9, 9, q('X={:.2f}, Y={:.2f}'.format, x, y),
         fontsize=16, va='top')

# Rectangle:
plt.plot(x * np.array([-1, 1, 1, -1, -1]),
         y * np.array([-1, -1, 1, 1, -1]),
         'k--o', linewidth=1)

# Ellipse:
phi = np.linspace(0, 2 * np.pi, 50)
plt.plot(x * np.cos(phi), y * np.sin(phi), 'r-', linewidth=4);
