Dragging whole object versus individual points
Moving a graphics object as a whole, or refining individual data points.
Features:
Graphics-driven assignments
Directing inverse assignments of binary operators
Dragging individual points versus whole object
Use of
qsyntax for non-quiby functions
Try me:
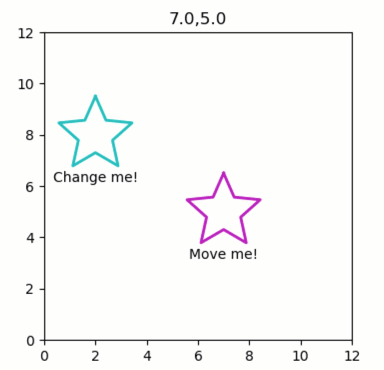
Try dragging the ‘Move me!’ star - it will move as a whole.
Try dragging the ‘Change me!’ star - it will change individual points.
from pyquibbler import iquib, initialize_quibbler, q
initialize_quibbler()
import matplotlib.pyplot as plt
import numpy as np
from numpy import pi
%matplotlib tk
# Figure setup:
fig1 = plt.figure(figsize=(4, 4))
ax = fig1.gca()
ax.axis('square')
ax.axis([0, 12, 0, 12]);
# Define star coordinates:
nPoints = iquib(5)
dtet = 2 * pi / (2 * nPoints)
tet = np.arange(0.5 * pi, 2.5 * pi, dtet)
rR = np.array([1.5, 0.7])
rs = np.tile(rR, (nPoints,))
xy_star = np.array([np.cos(tet), np.sin(tet)]) * rs;
# Allow changing the coordinates:
xy_star.allow_overriding = True
# Close the shapes by connecting the last point to the first point
xy_star_circ = np.concatenate([xy_star, xy_star[:, [0]]], axis=1)
def plot_star(ax, xy, txt, color):
    x, y = xy
    ax.text(np.mean(x), np.min(y) - 0.2, txt, ha='center', va='top')
    ax.plot(x, y, linewidth=2, color=color);
# Define and draw movable star:
xy_center_movable = iquib(np.array([[7.], [5.]]))

# using x_center_movable as the first argument in the summation
# (to which the inverse-assignment is channeled):
xy_movable_star = xy_center_movable + xy_star_circ
txt = q('Move me!\n{:.1f},{:.1f}'.format, xy_center_movable[0, 0], xy_center_movable[1, 0])
plot_star(ax, xy_movable_star, txt, color='m');
# Define and draw changeable star:
xy_center_fixed = iquib(np.array([[2.], [8.]]))

# using x_star_circ as the first argument in the summation
xy_changeable_star = xy_star_circ + xy_center_fixed
plot_star(ax, xy_changeable_star, 'Change me!', color='c');