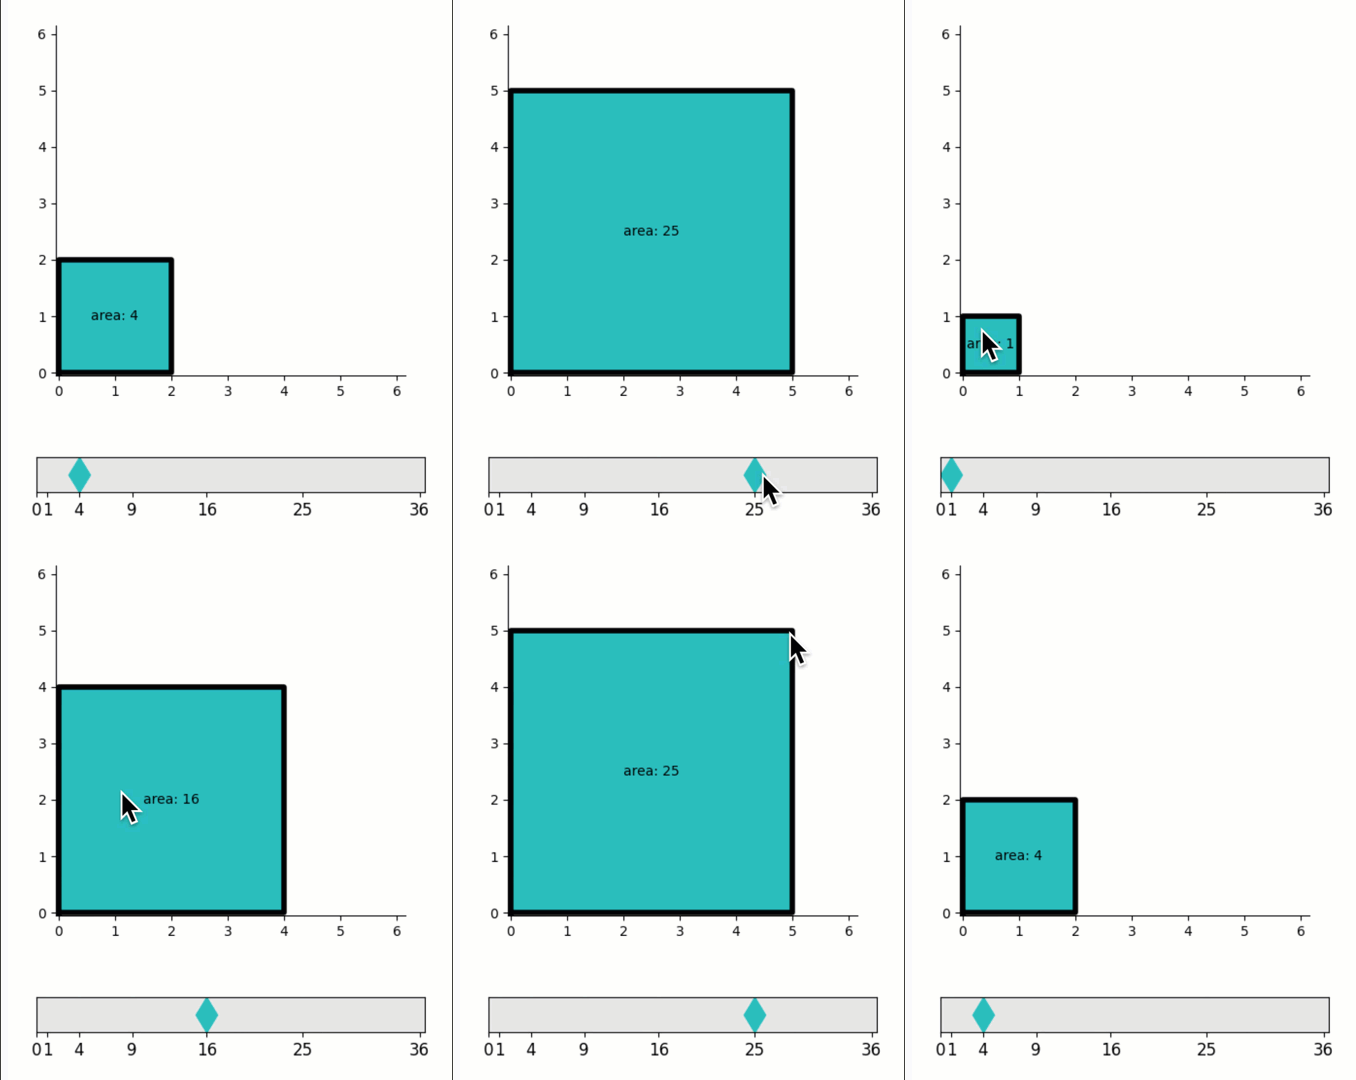
Dragging graphics between fixed points
A demo of interactively choosing among a fixed set of values.
Features
Graphics-driven assignments
Inverse assignments
Assignment template
Try me
Drag the cyan diamond marker to choose a square number.
Drag the corner of the cyan square.
from pyquibbler import iquib, initialize_quibbler, q
initialize_quibbler()
import matplotlib.pyplot as plt
import numpy as np
from matplotlib.patches import Rectangle
%matplotlib tk
# Prepare figure, axes
fig = plt.figure(figsize=(5, 6))

ax1 = fig.add_axes([0.1, 0.1, 0.8, 0.06])
ax1.axis([0, 36.5, 0, 1])
area_options = np.array(range(0, 7)) ** 2
ax1.set_xticks(area_options)
ax1.set_xticklabels(area_options, fontsize=12)
ax1.set_yticks([])
ax1.set_facecolor([0.9, 0.9, 0.9])

ax2 = fig.add_axes([0.1, 0.3, 0.8, 0.6])
ax2.axis('square')
ax2.axis([-0.05, 6.15, -0.05, 6.15])
ax2.spines['top'].set_visible(False)
ax2.spines['right'].set_visible(False)
# Define x, x_square
# (use assingment_template to limit values of x)
x = iquib(2).setp(assignment_template=(0, 6, 1))
x_square = x ** 2
# Plot draggable x_square.
# (the marker position will be limitted to square numbers)
ax1.plot(x_square, 0.5, 'dc', markersize=18, pickradius=25);
# Plot the black sqaure, with text
square = Rectangle((0, 0), x, x, facecolor='c')
ax2.add_patch(square)
ax2.plot([0, x, x, 0, 0], [0, 0, x, x, 0], 'k-', linewidth=4)
ax2.text(x/2, x/2, q("area: {:.0f}".format, x_square),
         ha='center',  va='center');
