Dragging graphics of periodic functions
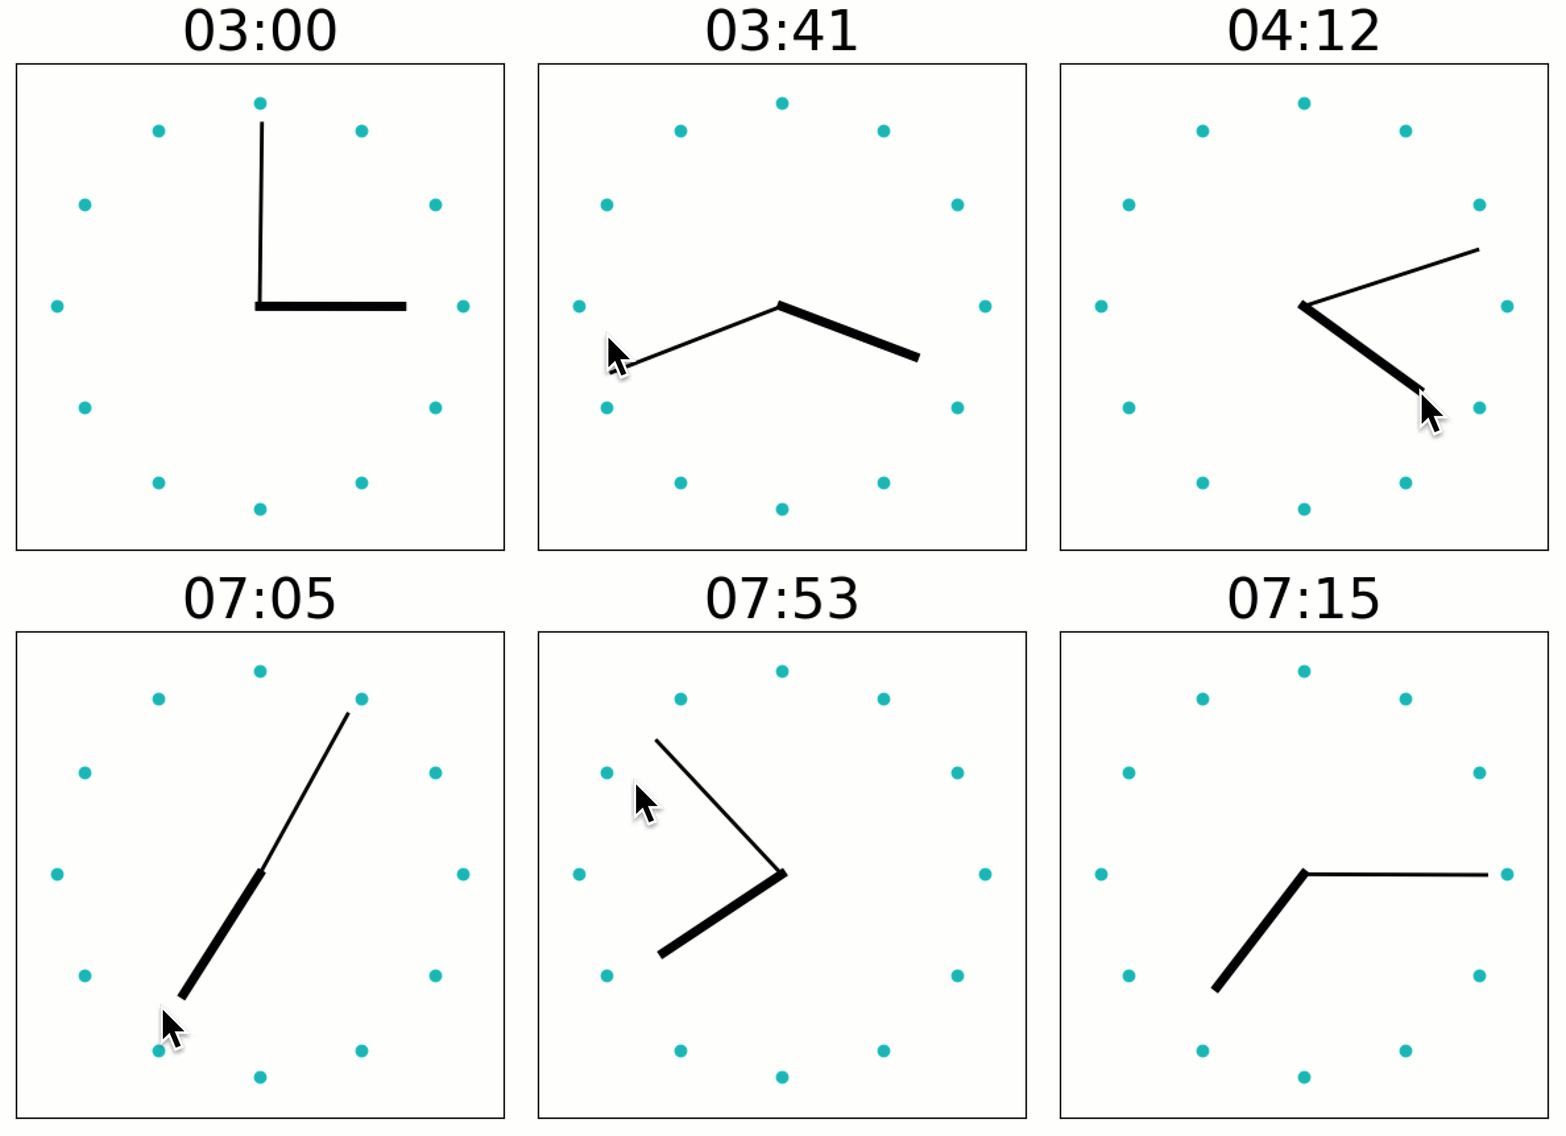
A demo of interactively adjusting the hands of an analog clock.
Features
Graphics quibs
Graphics-driven assignments
Dragging with functional constrains
Inverse-assignment of periodic functions
Try me
Try dragging the minute hand or the hour hand of the clock.
from pyquibbler import iquib, initialize_quibbler, q
initialize_quibbler()
import matplotlib.pyplot as plt
import numpy as np
%matplotlib tk
# Set figure
plt.figure()
plt.clf()
plt.axis('square')
plt.axis([-1.2, 1.2, -1.2, 1.2])
plt.setp(plt.gca(), xticks=[], yticks=[])
plt.rc('axes', titlesize=30)

# Plot the hour dots
a = np.arange(12) / 12 * 2 * np.pi
plt.plot(np.cos(a), np.sin(a), 'co')

# Plot the hands
def plot_hand(rot, r, **kwargs):
    phi = (-rot + 0.25) * 2 * np.pi
    plt.plot([0, np.cos(phi) * r], [0, np.sin(phi) * r], **kwargs)

t = iquib(3.)  # time in hours
plot_hand(t / 12, r=0.7, color='k', linewidth=5)
plot_hand(t, r=0.9, color='k', linewidth=2)
plt.title(q('{:02.0f}:{:02.0f}'.format, t // 1, 60 * (t - t // 1)));
