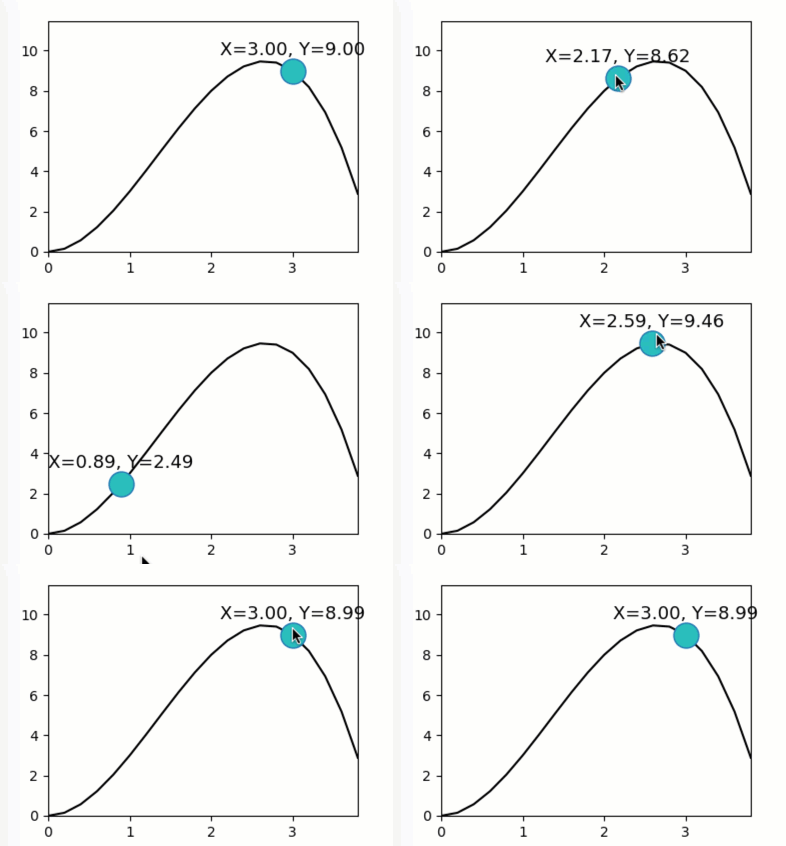
Dragging graphics along a curved line
A demo of interactively dragging a point along a curved line.
Features
Graphics quibs
Graphics-driven assignments
Dragging with functional constrains
Try me
Try dragging the circle along the functional curve.
from pyquibbler import iquib, initialize_quibbler, q
initialize_quibbler()
import matplotlib.pyplot as plt
import numpy as np
%matplotlib tk
# Define and plot a curve:
curve_function = lambda v: 4 * v ** 2 - v ** 3
graph_xs = np.arange(0, 4, .2)
graph_ys = curve_function(graph_xs)
plt.figure(figsize=(4, 3))
plt.plot(graph_xs, graph_ys, 'k')
plt.axis([0, 4, 0, 12])

# Define x-y quibs:
point_x = iquib(3.)
point_y = q(curve_function, point_x)

# Plot the x-y point:
plt.plot(point_x, point_y,
         marker='o', markerfacecolor='c',
         markersize=18, pickradius=20)

# Define and plot text:
xy_str = q("X={:.2f}, Y={:.2f}".format, point_x, point_y)
plt.text(point_x, point_y + .6, xy_str,
         ha="center", va="bottom", fontsize=13);
