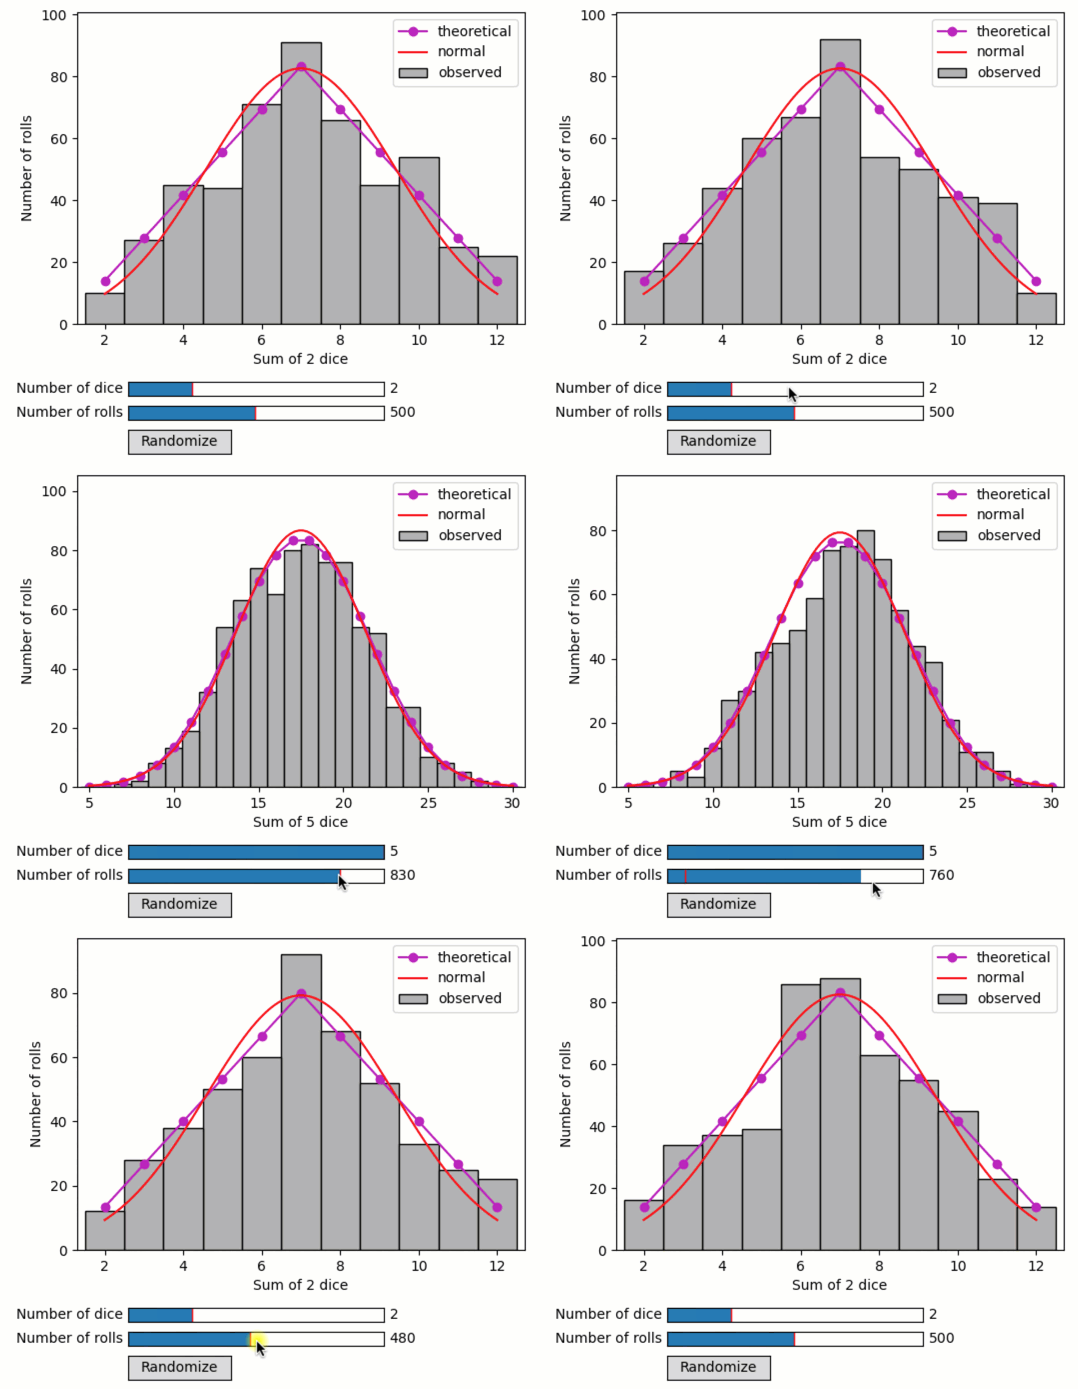
Quibs of random functions - dice rolling
A demo of a quib-based analysis involving random numbers
Features
Random quibs
Assignment template
Graphics-driven assignments
Quib-linked widgets
Try me
Try playing with the number of dice or the number of rolling.
Try pressing ‘Randomize’ to re-randomize random-function quibs.
from pyquibbler import iquib, initialize_quibbler, q, quiby, reset_random_quibs
initialize_quibbler()

import matplotlib.pyplot as plt
from matplotlib.widgets import Slider, Button
import numpy as np

%matplotlib tk
# Inputs
num_dice = iquib(2)
num_rolls = iquib(500)
num_sides = iquib(6)
results = np.random.randint(1, num_sides + 1, (num_rolls, num_dice));
# Prepare figure
fg = plt.figure()
ax = fg.add_axes([0.15, 0.3, 0.7, 0.65])
ax.set_xlabel('Sum of ' + q(str, num_dice) + ' dice')
ax.set_ylabel('Number of rolls');
# Histogram of sum of the dice in each roll
sum_dice = np.sum(results, axis=1)
plt.hist(sum_dice, bins=np.arange(num_dice - 0.5, num_dice * num_sides + 1.5),
         ec='k', facecolor=[0.7, 0.7, 0.7])
ax.set_xlim([num_dice - 0.7, num_dice * num_sides + 0.7]);
# Plot exact distribution
def p_sum_dice(n_dice, n_sides, total):
    # Returns the probability of getting a sum n when rolling
    # num_dice dice with num_sides sides
    if n_dice == 1:
        # equal probability for each outcome
        ps = np.zeros(total.shape)
        ps[(1 <= total) & (total <= n_sides)] = 1 / n_sides
        return ps
    return sum(1/n_sides * p_sum_dice(n_dice - 1, n_sides, total-outcome)
               for outcome in range(1, n_sides+1))

xx = np.arange(num_dice, num_dice * num_sides + 1)
p = q(p_sum_dice, num_dice, num_sides, xx)
ax.plot(xx, p * num_rolls, 'mo-');
# Plot normal approximation
@quiby
def p_normal(m,s,x):
    return 1 / s / np.sqrt(2 * np.pi) * np.exp(-0.5 * ((x - m) / s)**2)

std = np.std(np.arange(1, num_sides + 1))
mean = np.average(np.arange(1, num_sides + 1))
se = std * np.sqrt(num_dice)
mn = mean * num_dice
xx = np.linspace(num_dice, num_dice * num_sides, 100)
p = p_normal(mn, se, xx)
ax.plot(xx, p * num_rolls, 'r-');
# set ylim to max expected + 2 std
mx_count_expected = p_normal(mn, se, mn) * num_rolls
ax.set_ylim([0, mx_count_expected + 2 * np.sqrt(mx_count_expected)]);
# legend
plt.legend(['theoretical', 'normal', 'observed']);
# Add slider controls
Slider(ax=fg.add_axes([0.23, 0.15, 0.4, 0.03]), label='Number of dice',
       valmin=1, valmax=5, valinit=num_dice, valstep=1)
Slider(ax=fg.add_axes([0.23, 0.10, 0.4, 0.03]), label='Number of rolls',
       valmin=10, valmax=1000, valinit=num_rolls, valstep=10);
# Add randomize button
randomize = Button(fg.add_axes([0.23, 0.03, 0.16, 0.05]), 'Randomize')
randomize.on_clicked(lambda _: reset_random_quibs());
