Compare images
Pairwise image comparison demonstrating diverged analysis.
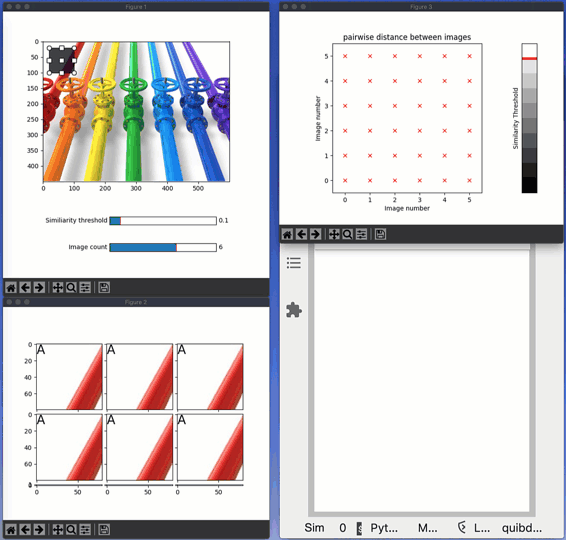
In this example, we analyze similarity among a set of images. Specifically, the pipeline involves the following three steps:
cutting n sub-images from a source image based on user-specified Region Of Interests (ROIs).
performing all pair-wise color-comparisons among these cut images.
clustering the images based on their pairwise color similarity.
When a single ROI changes (by being dragged), Quibbler knows to only make the calculation needed: re-cutting the specific corresponding image and re-calculating the pairwise comparisons of this specific image with all other images (2*n-1 recalculations).
A print command within the image-cutting and the image-comparison functions allows tracking functional call (dragging an ROI should follow by a report of a single “Cutting image …” and then 2*n-1 “Comparing …” messages).
Features
Diverged calculations of quib slices
Calling user function with np.vectorize
Graphics-driven assignments
Inverse assignments
Assignment template
Try me
Drag each region of interest to define the cut images. Watch the number of re-calculations being made.
Change the similarity threshold either with the slider or on the color-scale.
Add or remove images with the “Image count” slider.
# Imports:

import pyquibbler as qb
from pyquibbler import iquib, q
qb.initialize_quibbler()

import numpy as np
from scipy.sparse.csgraph import connected_components
from functools import partial
from matplotlib import pyplot as plt, widgets
from mpl_toolkits.axes_grid1 import ImageGrid

%matplotlib tk
# Define vectorized analysis steps:

@partial(np.vectorize, signature='(4),()->()', pass_quibs=True, is_graphics=True)
def create_roi(roi, axs):
    rectprops = dict(facecolor='k', edgecolor='k', alpha=0.2, fill=True)
    widgets.RectangleSelector(axs, extents=roi, props=rectprops)


@partial(np.vectorize, signature='(w,h,c),(4),()->()',otypes=[object])
def cut_image(image, roi, image_id):
    print(f'Cutting image {image_id}')
    return image[roi[2]:roi[3], roi[0]:roi[1]]


@partial(np.vectorize, otypes=[float])
def image_distance(img1, img2, image_id1, image_id2):
    print(f'Comparing {image_id1} -> {image_id2}')
    rgd_distance = np.average(img1, axis=(0, 1)) - np.average(img2, axis=(0, 1))
    return np.linalg.norm(rgd_distance / 255)


@partial(np.vectorize, signature='(),()->()', is_graphics=True)
def show_cut_images(ax, img):
    ax.imshow(img)


@partial(np.vectorize, signature='(),()->()', is_graphics=True)
def plot_image_cluster_label(ax, index):
    ax.text(0, 0, chr(index+65), fontsize=20, ha='left', va='top')


@partial(np.vectorize, is_graphics=True)
def show_adjacency(axs, x, y, adjacent):
    symbol = 'x' if adjacent else '.'
    axs.plot(x, y, symbol, color='r')
# Read and draw source image
file_name = iquib('pipes.jpg')
image = plt.imread(file_name)

plt.figure(1, figsize=[6, 6])
ax1 = plt.axes([0.15, 0.3, 0.7, 0.65])
ax1.imshow(image);
# Define ROIs:
num_images = iquib(6, assignment_template=(0, 10, 1))
image_ids = np.arange(num_images)

roi_default = iquib([[20, 100, 20, 100]], allow_overriding=False)

rois = np.repeat(roi_default, num_images, axis=0).setp(allow_overriding=True)

similiarity_threshold = iquib(.1)
# Cut the images from image according to the rois
cut_images = cut_image(image, rois, image_ids)
# Draw the rois
create_roi(rois, ax1);
# Add slides for similarity threshold and image count:
widgets.Slider(
    ax=plt.axes([0.4, 0.2, 0.4, 0.03]),
    label="Similiarity threshold",
    valmin=0, valmax=1, valstep=.05,
    valinit=similiarity_threshold)

widgets.Slider(
    ax=plt.axes([0.4, 0.1, 0.4, 0.03]),
    label="Image count",
    valmin=1, valmax=9, valstep=1,
    valinit=num_images);
# Figure 2 - Plot the cut images
fig = plt.figure(2)
grid_axes = iquib(ImageGrid(fig, 111, nrows_ncols=(3, 3), axes_pad=0.1))
show_cut_images(grid_axes[:num_images], cut_images) \
    .setp(graphics_update='drop');
Cutting image 0
Cutting image 1
Cutting image 2
Cutting image 3
Cutting image 4
Cutting image 5
# Calculate all pairwise image comparisons
image_distances = image_distance(np.expand_dims(cut_images, 1), cut_images,
                                 np.expand_dims(image_ids, 1), image_ids)
adjacents = image_distances < similiarity_threshold
# Figure 3 - Plot distance matrix
fig = plt.figure(3)
fig.clf()
axs = fig.add_axes([0.1, 0.15, 0.7, 0.7])
axs.imshow(1 - image_distances, cmap='gray', vmin=0, vmax=1) \
    .setp(graphics_update='drop')
axs.axis([-0.5, num_images-0.5, -0.5, num_images-0.5])
axs.set_title('pairwise distance between images')
axs.set_xlabel('Image number')
axs.set_ylabel('Image number')


show_adjacency(axs, np.expand_dims(image_ids, 1), image_ids, adjacents) \
    .setp(graphics_update='drop')

# colormap
axclr = fig.add_axes([0.85, 0.15, 0.06, 0.7])
clrmap = np.linspace(1, 0, 10).reshape(10, 1)
axclr.imshow(clrmap, cmap='gray', vmin=0, vmax=1)
axclr.plot([-0.5, 0.5], similiarity_threshold * 10 - 0.5 + np.array([0, 0]),
           '-r', linewidth=4, picker=True)
axclr.set_xticks([])
axclr.set_yticks([])
axclr.set_ylabel('Similarity Threshold');
Comparing 0 -> 0
Comparing 0 -> 1
Comparing 0 -> 2
Comparing 0 -> 3
Comparing 0 -> 4
Comparing 0 -> 5
Comparing 1 -> 0
Comparing 1 -> 1
Comparing 1 -> 2
Comparing 1 -> 3
Comparing 1 -> 4
Comparing 1 -> 5
Comparing 2 -> 0
Comparing 2 -> 1
Comparing 2 -> 2
Comparing 2 -> 3
Comparing 2 -> 4
Comparing 2 -> 5
Comparing 3 -> 0
Comparing 3 -> 1
Comparing 3 -> 2
Comparing 3 -> 3
Comparing 3 -> 4
Comparing 3 -> 5
Comparing 4 -> 0
Comparing 4 -> 1
Comparing 4 -> 2
Comparing 4 -> 3
Comparing 4 -> 4
Comparing 4 -> 5
Comparing 5 -> 0
Comparing 5 -> 1
Comparing 5 -> 2
Comparing 5 -> 3
Comparing 5 -> 4
Comparing 5 -> 5
# add cluster label
cluster_indeces = q(connected_components, adjacents)[1]
plot_image_cluster_label(grid_axes[:num_images], cluster_indeces) \
    .setp(graphics_update='drop');