Overriding default values (two-levels)
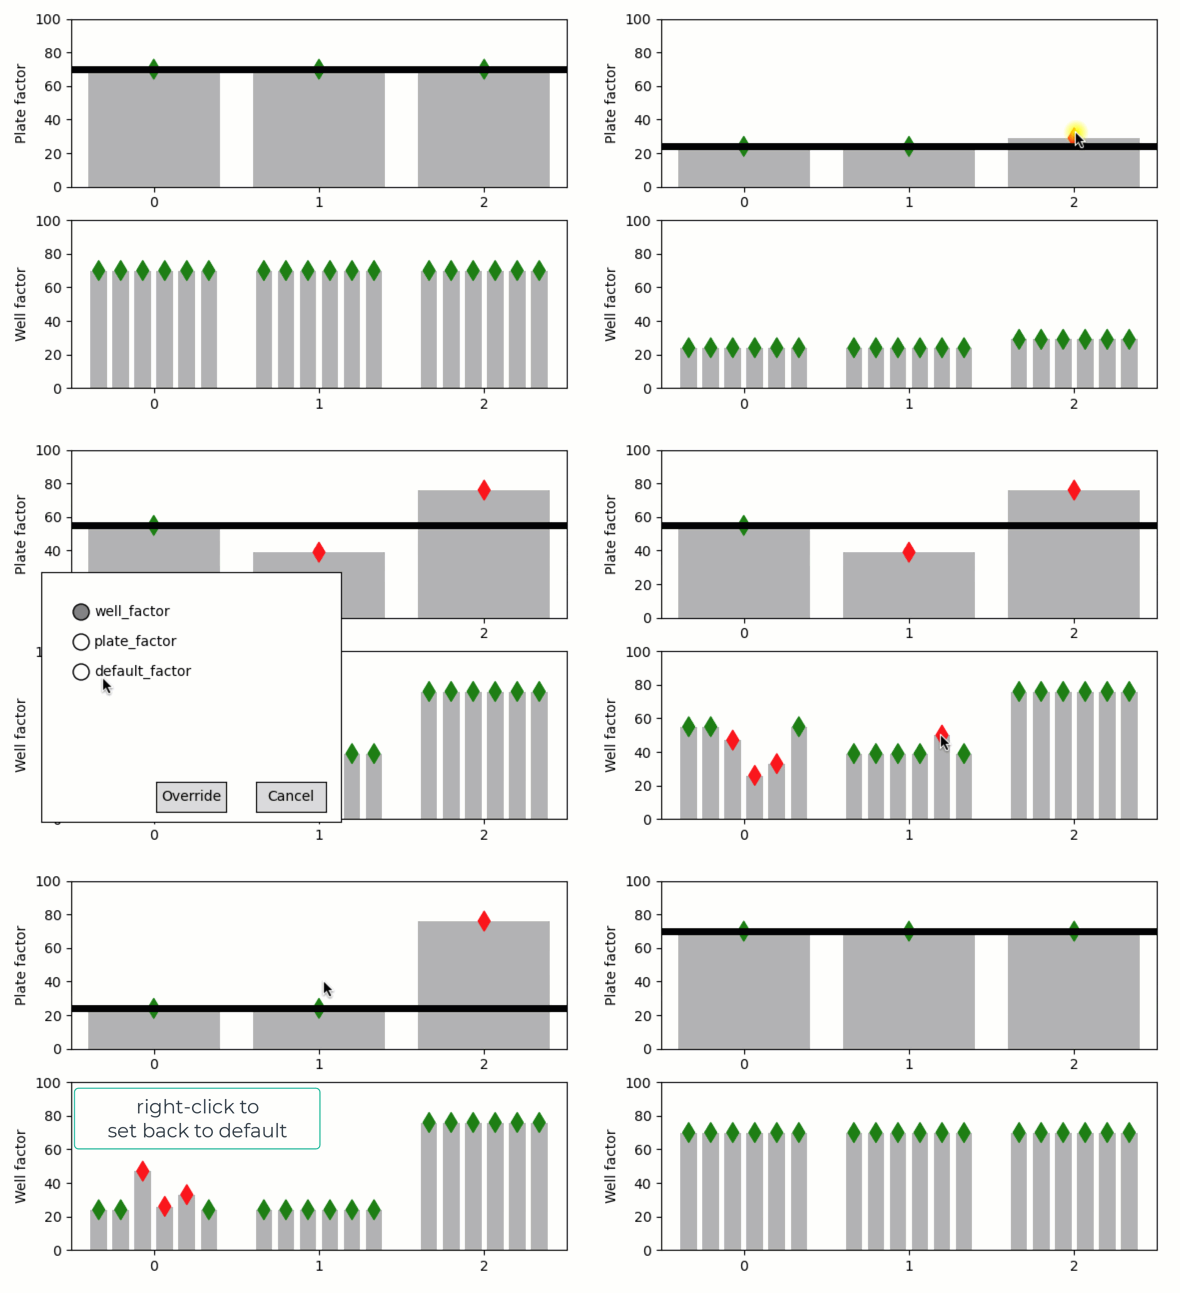
A demo of two-level default and overriding.
Say we have several “plates”, and each of these plates has several “wells”, and we want to apply a function to each well in each plate with some default factor. We need a way to choose this factor globally, but we might sometimes need to adjust it for a specific plate and even for a specific well within a plate. Essentially, we would like to replicate the “default factor” for each plate and then to replicate these plate factors for each well, while allowing “overriding” of these copies at each level. In Quibbler, as shown here, such behavior is achieved quite seamlessly using overriding of function quibs.
Features
Overriding
Override mask
Graphics-driven assignments
Inverse assignments
Assignment template
Try me
Drag the horizontal line to change the “default factor”
Drag the “per-plate factor” markers will prompt asking if assignments should be interpreted as overrides to the “plate-facor”, or propagate upstream to change the default.
Drag the “per-well factor” markers will prompt asking if assignments should be interpreted as overrides at the well level, or inverse-propagate one step up to the plate level, or two step up to the default level.
from pyquibbler import iquib, initialize_quibbler, q
initialize_quibbler()
import matplotlib.pyplot as plt
from matplotlib.colors import ListedColormap
import numpy as np
%matplotlib tk
# Set number of plate and number wells per plate
n_plates = iquib(3)
n_wells = iquib(6)
# Figure setup
plt.figure()

ax1 = plt.subplot(2, 1, 1)
ax1.axis([-0.5, n_plates - 0.5, 0, 100])
ax1.set_ylabel('Plate factor')
ax1.set_xticks(np.arange(n_plates))

ax2 = plt.subplot(2, 1, 2)
ax2.axis([-0.5, n_plates - 0.5, 0, 100])
ax2.set_ylabel('Well factor')
ax2.set_xticks(np.arange(n_plates));
# Common properties
input_properties = {
    'assignment_template': (0, 100, 1),
    'allow_overriding': True
}
# Scatter with two colors
def two_color_scatter(ax, x, y):
    return ax.scatter(x, y,
                      marker='d', s=100, zorder=2,
                      cmap=ListedColormap(['green', 'red']),
                      c=y.get_override_mask(),
                      vmin = 0, vmax = 1,
                      pickradius=10)
# Define and plot the default factor
default_factor = iquib(70).setp(**input_properties)
ax1.plot([-0.5, n_plates-0.5],
         default_factor + np.array([0, 0]),
         'k',
         linewidth=5);
# Define and plot the per-plate factor
plate_factor = np.repeat(default_factor, n_plates, 0)
plate_factor.setp(**input_properties)
x = np.arange(n_plates)
ax1.bar(x, plate_factor, color=(0.7, 0.7, 0.7))
two_color_scatter(ax1, x, plate_factor);
# Define and plot the per-plate-per-well factor
well_factor = np.repeat(plate_factor, n_wells, 0)
well_factor.setp(**input_properties)
dd = np.linspace(-0.4, 0.4, n_wells + 1)
dd = (dd[0:-1] + dd[1:]) / 2.
xx = np.ravel(x + np.reshape(dd, (n_wells, 1)), 'F')
ax2.bar(xx, well_factor, color=(0.7, 0.7, 0.7), width=0.1)
two_color_scatter(ax2, xx, well_factor);
