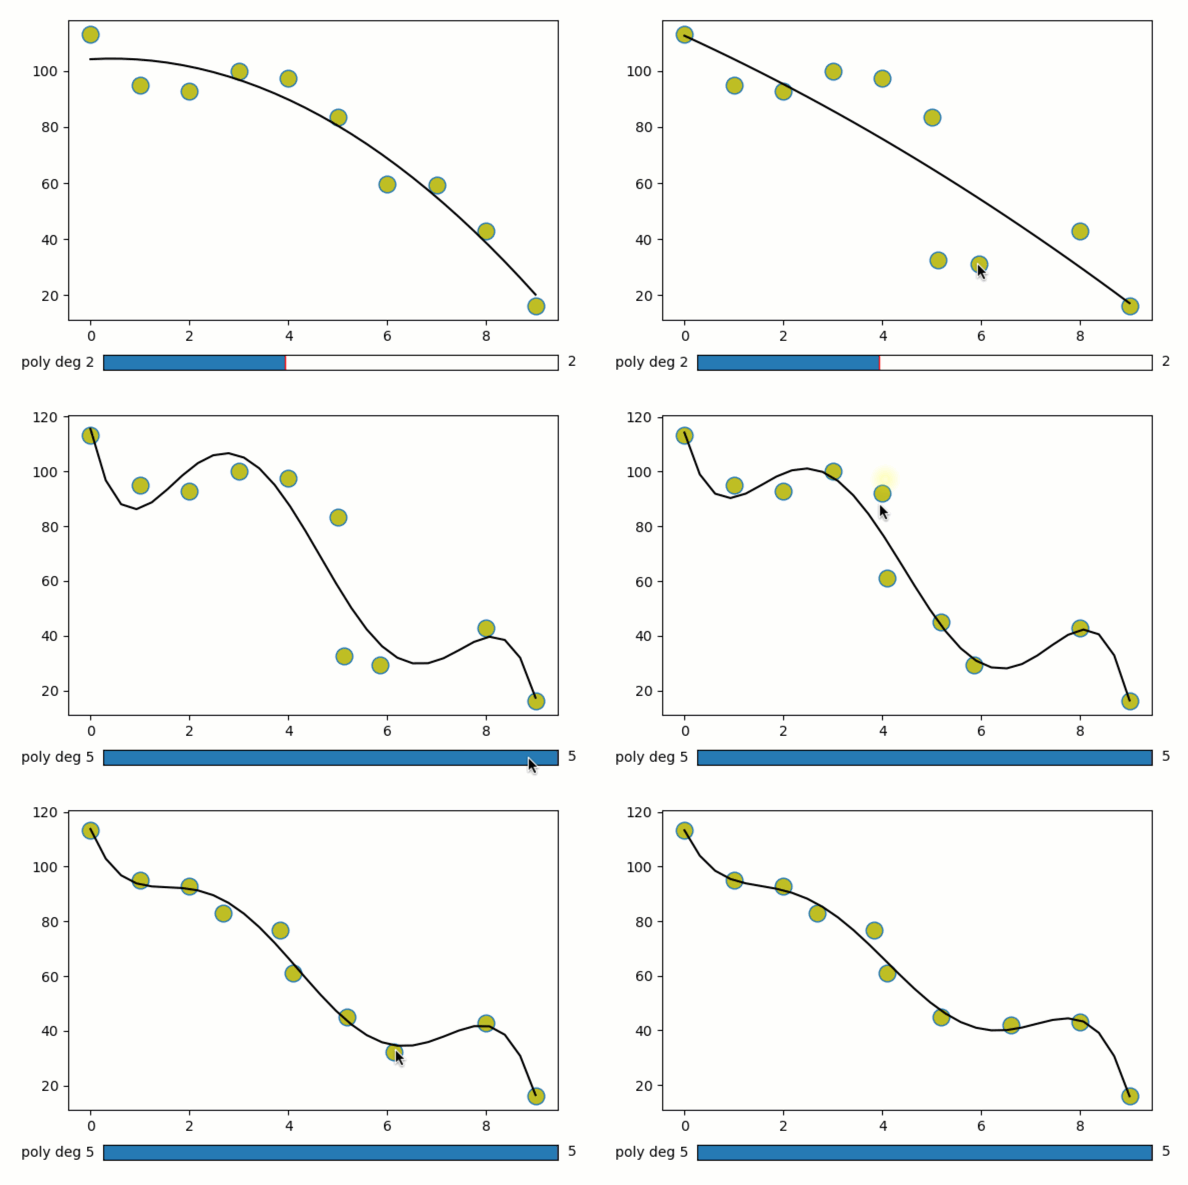
Multi-point dragging and widgets
Plot and fit multiple individually-draggable data points.
Features
Graphics-driven assignments of multiple points
Inverse assignments
Assignment template
Try me:
Try dragging the data points.
Try changing the degree of the polynomial fit with the slider.
from pyquibbler import iquib, initialize_quibbler, q
initialize_quibbler()
import matplotlib.pyplot as plt
from matplotlib import widgets
import numpy as np
%matplotlib tk
# Define x, y data points
num_points = iquib(10)
x = np.arange(0., num_points)
y = 100. - np.arange(0., num_points)**2

# Add random noise
y = y + 5 * np.random.randn(num_points)

# Allow overrding the default functional values of x, y:
x.allow_overriding = True
y.allow_overriding = True

# Define figure, axes:
plt.figure(figsize=[7, 5])
ax = plt.axes([0.2, 0.2, 0.7, 0.6])

# Plot the x-y points. Setting picker=True to allow dragging
ax.plot(x, y,
        marker='o', markersize=12, markerfacecolor='y',
        linestyle='None', pickradius=15)

# Define polynomial fit degree:
n_poly = iquib(2)

# Connect polynomial fit with slider:
ax_slider = plt.axes([0.25, 0.1, 0.65, 0.03])
freq_slider = widgets.Slider(
    ax=ax_slider, valmin=0, valmax=5, valstep=1,
    label=q("poly deg {:.0f}".format, n_poly), valinit=n_poly)

# Perform and plot the polynomial fit:
pf = np.polyfit(x, y, n_poly)
x0 = np.linspace(np.min(x), np.max(x), 30)
y0 = np.polyval(pf, x0)
ax.plot(x0, y0, 'k-');
